
The digital nomad population has exploded over the past five years. This post breaks down the latest statistics on nomad numbers, demographics, income, top destinations and cost of living. Whether you’re reporting on remote work trends or writing your next feature, these numbers give you a solid factual foundation.

Author

Co-author

The digital nomad population has exploded over the past five years. This post breaks down the latest statistics on nomad numbers, demographics, income, top destinations and cost of living. Whether you’re reporting on remote work trends or writing your next feature, these numbers give you a solid factual foundation.
Author
Co-author
Get in Touch with Us
Alp Atasoy
Sales and Business Development Consultant


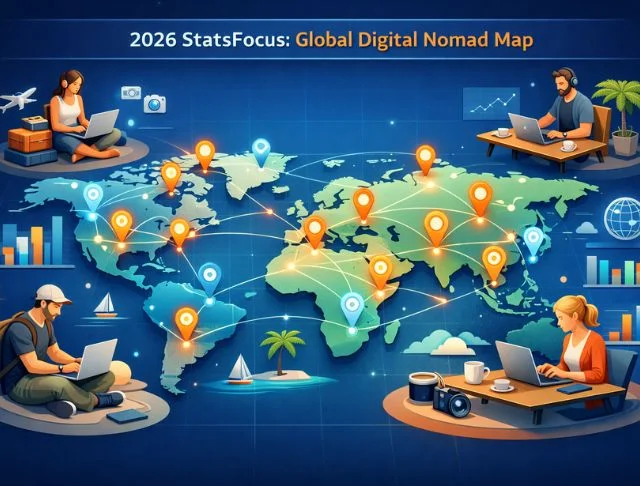

The numbers behind digital nomadism have grown too big to ignore. Here’s a close look at the data that tells the full story.
The global digital nomad population sits at over 40 million workers. The World Economic Forum puts the figure at “over 40 million,” and most credible industry sources land in the same range.
That said, some community surveys push the number much higher. Nomads.com, for instance, has reported figures closer to 80 million globally. The gap comes down to how you define a digital nomad.
The U.S. leads the world by a wide margin. According to MBO Partners’ 2025 report, 18.5 million Americans now work as digital nomads. That’s 12% of the entire U.S. workforce.
From 2019 to 2025, U.S. nomad numbers went up by over 153%. That’s not a trend. That’s a full-blown workforce shift.
WYSE Travel Confederation estimated over 40 million global nomads in 2023. Passport Photo Online puts the current figure at around 45 million. Both organizations project roughly 60 million by 2030.
For a clearer year-by-year picture, U.S. data from MBO Partners gives the best window into the trend:
Year | U.S. Nomads | YOY Change |
2019 | 7.3M | — |
2020 | 10.9M | +49% |
2021 | 15.5M | +42% |
2022 | 16.9M | +9% |
2023 | 17.3M | +2.3% |
2024 | 18.1M | +4.7% |
2025 | 18.5M | +2.2% |
The pandemic broke something open. Before 2020, digital nomadism was mostly a niche lifestyle. After 2020, it turned into a mass movement.
In the U.S. alone, nomad numbers jumped from 7.3 million in 2019 to 15.5 million by 2021. That’s a 112% increase in just two years. The single biggest leap came between 2019 and 2020, when COVID lockdowns forced remote work on millions of people overnight.
Growth then started to cool off. By 2022 it was +9%. By 2023 and 2024, it had settled into the 2–5% range. That’s not a decline. That’s maturity. The base is bigger, and the growth is steadier.
Resources: Mbopartners, Weforum, Wysetravel, Nomads, Passport-photo, Statista

Growth in digital nomadism didn’t happen in a straight line. The data shows a clear shift from explosive early gains to a more stable, long-term trend.
Remote work didn’t just support the nomad trend. It created it.
By 2024, around 40% of the global workforce and 35% of U.S. workers were remote at least part of the time. Projections for 2025 put roughly 22% of Americans, or about 32.6 million people, as fully remote workers.
That pool of location-independent workers is the talent base that feeds nomadism. The bigger it gets, the more potential nomads exist.
Some cities have turned into full-on nomad magnets. A few names keep coming up in every credible ranking and analyst report.
In Latin America, Mexico leads the charge. Mexico City, Mérida, Oaxaca and Playa del Carmen all draw large and fast-growing nomad crowds. Medellín in Colombia has built a strong reputation for affordability and community.
In Asia, Bangkok and Bali pull in the biggest numbers. Both cities rank among the top DN hubs in the entire region.
In Europe, Lisbon holds its spot near the top of global city lists. Portugal as a whole continues to attract nomads through its D8 visa program.
These cities share a few things: affordable cost of living, good internet and strong existing nomad communities.
Resources: Mbopartners, Statista, Adb, Nomadlist, Localyze

No single database tracks every nomad in every country. But regional data and visa stats help build a solid picture of where the movement is concentrated.
Europe doesn’t have an official nomad headcount, but industry breakdowns give a rough idea of its share. Statista data suggests the UK holds about 7% of global nomads, Germany around 4%, France 3%, the Netherlands 2% and Spain 2%. Combined, that’s roughly 18% of the global base.
Portugal and Croatia have made the biggest policy moves on this front. Portugal’s D8 visa had already issued around 2,600 approvals by 2024. Spain and Croatia have launched similar programs to pull in remote workers from outside the EU.
North America is home to roughly half the world’s digital nomads. The U.S. alone accounts for about 47% of the global total, and Canada adds another 4%. Together, that puts North America at around 51% of the worldwide nomad population, or somewhere between 20 and 21 million people.
Mexico doesn’t show up in those percentage breakdowns, but it plays a major role as a destination. Mexico City consistently ranks among the top nomad hubs worldwide, and Mexico’s long-stay visa allows multi-year residency for remote workers.
Asia-Pacific doesn’t have a centralized nomad count, but the region’s policy moves tell the story. Countries like Thailand, Indonesia, Malaysia, Japan and South Korea have all rolled out nomad visa programs in recent years.
Thailand launched a five-year Long-Term Resident visa in 2024. Indonesia’s Bali has become one of the most recognized nomad destinations on the planet. Bangkok pulls in huge numbers of remote workers drawn by low costs and strong infrastructure.
Latin America has come into its own as a major nomad region. Mexico City and Medellín in Colombia are two of the most cited hubs anywhere in the world.
Brazil accounts for roughly 2% of global nomads. Mexico’s long-stay visa allows residency for up to four years, which makes it a practical base for long-term nomads. Costa Rica and Panama have both launched their own remote-work visa programs to draw more of this crowd in.
Data for this region is thin, but activity is picking up. The UAE rolled out a one-year renewable remote-work visa in 2026. Cape Town in South Africa has built a real nomad community over the past few years. Rwanda has also stepped up efforts to draw remote workers to Kigali.
As of 2024, roughly 60 countries worldwide had some form of nomad or remote-work visa in place. Several of those are in the MENA region and Africa.
Resources: Statista, Mbopartners, Nomadlist, Wysetravel, Weforum
Hard numbers at the country level are rare. Most governments track visa approvals, not nomad populations, so the data below reflects the best available figures.
Portugal doesn’t publish an official nomad headcount, but its visa data tells a clear story. By the end of 2024, over 2,600 D8 digital nomad visas had been granted. On top of that, Portugal issued 4,941 residence permits to U.S. citizens in 2024 alone, many of them D8 holders.
Australia doesn’t have a dedicated digital nomad visa. Remote workers and location-independent professionals typically enter on tourist or skilled-work visas, and the government doesn’t track them separately.
The country remains a popular destination for remote workers generally, but without a formal visa category, there’s no reliable count to point to.
Spain launched its digital nomad visa under the Startup Act in 2023, and the country shot to the top of the rankings fast. In 2025, Spain ranked #1 in the Global Digital Nomad Index.
The Spanish government hasn’t released a consolidated count of DN visa holders. Anecdotal reports point to strong uptake, but exact figures remain unavailable. What is clear is that Spain’s combination of climate, cost and connectivity has made it one of the most sought-after nomad destinations in Europe.
Thailand made a major policy move in 2024 with the launch of its long-term Remote Worker Visa, which allows stays of up to five years. Bangkok consistently ranks among the world’s leading digital nomad cities, and the new visa program has added real structure to what was already a massive informal nomad scene.
Indonesia formalized its appeal to nomads in 2024 with a new “second home” visa valid for up to five years. Bali, particularly the areas around Canggu and Ubud, has been an iconic nomad hub long before any official visa existed.
Resources: Nomadlist, Sq, Localyze, Passport-photo, Statista, Mbopartners
City-level data is even harder to pin down than country-level figures. What exists comes from coworking surveys, expat communities and travel reports rather than any official census.
Mexico City stands out as the top digital nomad hub in Mexico, and one of the most talked-about in the entire world. Mexico’s Temporary Resident Visa allows stays of up to four years, which makes the city a practical long-term base for location-independent workers.
The combination of low cost of living, a thriving expat scene and strong infrastructure has drawn a wave of American and European nomads. A 2026 Daily Show report specifically noted the rising presence of American digital nomads in Mexico City.
Bangkok is the dominant digital nomad city in Southeast Asia. Low living costs, fast internet and a well-developed coworking infrastructure all work in its favor. Thailand’s new long-stay nomad visa, launched in 2024, has given the city’s already large remote-worker community a more formal foundation.
Bali may be the most iconic digital nomad destination on the planet. Long before Indonesia introduced its second home visa in 2024, nomads were finding ways to stay long-term through social visas and other workarounds.
The expat and nomad community in Bali is widely estimated in the tens of thousands. Canggu and Ubud function almost like nomad villages at this point, with coworking spaces, nomad meetups and remote-work cafes on nearly every street.
The new 2024 visa is expected to push those numbers higher as the program matures and uptake data starts to come in.
Lisbon is Europe’s most recognized digital nomad city. Affordable high-speed internet, a walkable layout and Portugal’s D8 visa have all worked together to build one of the strongest nomad communities on the continent.
No government body releases a city-level nomad count, but the 2,600+ D8 visas granted Portugal-wide by end of 2024 give a floor estimate for the formal nomad population. The real number, counting people on tourist stays and other visa types, is likely much higher.
Medellín has gone from a city people once avoided to one of the most talked-about nomad destinations in Latin America. Affordability, good weather and a fast-growing local startup scene have all helped it earn that reputation.
Colombia’s Friendly Nations visa and digital nomad-friendly policies have made it easier for foreigners to set up longer-term stays. No exact population figure exists, but Medellín tops Latin America nomad surveys year after year.
Resources: Nomadlist, Sq, Localyze, Passport-photo, Statista, Mbopartners

Who actually becomes a digital nomad? The data points to a fairly consistent profile across surveys, though the lifestyle cuts across more age groups and backgrounds than most people expect.
Millennials lead the pack. About 42% of digital nomads fall into the Millennial bracket, making them the dominant generation in the space. Gen X comes in at 23%, Gen Z at 19% and Baby Boomers at 13%.
Another way to cut the data: 53% of nomads are between 30 and 39 years old, and 22% are under 30. That puts roughly three-quarters of the global nomad population under 40.
Men make up the majority of digital nomads, but the gap isn’t as wide as some stereotypes suggest. Most surveys put the split at roughly 56–60% male and 40–44% female. Some community polls skew higher, reporting up to 68% men.
Digital nomads are a highly educated group. Over 90% hold at least a college degree. One study puts the figure at 91%, with 54% holding a bachelor’s degree specifically.
That level of education reflects the kinds of work nomadism supports. Tech roles, creative work, consulting and marketing all tend to require formal training or specialized skills, which most nomads bring to the table.
Americans dominate the global nomad population. About 47% of all digital nomads worldwide are U.S. citizens. No other country comes close.
Country | Global Share |
United States | ~47% |
United Kingdom | ~7% |
Russia | ~5% |
Canada | ~4% |
Germany | ~4% |
France | ~3% |
Australia, Brazil and the Netherlands each account for around 2%. The heavy U.S. tilt reflects both the size of the American remote-work market and the relative wealth that makes long-term travel financially viable.
Resources: Statista, Mbopartners, Nomadlist, Pumble

The financial side of nomadism is often misunderstood. The data shows a population that earns well above average, works across a range of setups and clusters heavily in tech and creative fields.
Tech and creative roles lead across every major survey. Software developers, web developers and SaaS specialists make up a large portion of the nomad workforce. Marketing professionals, startup founders and consultants round out the top of the list.
Digital nomads earn well above the global average. Survey data puts the mean annual income at around $124,000, with a median closer to $85,000.
The distribution skews upward. About 49% of nomads earn over $100,000 per year. Only around 6% earn under $25,000.
Those numbers challenge the “broke backpacker” image that sometimes gets attached to the nomad label. For many in this group, location independence is a choice, not a constraint.
The nomad workforce splits into three main groups. About 41% are freelancers, 34% work as full-time employees and 25% run their own businesses as entrepreneurs or solopreneurs.
U.S. data from 2025 adds another layer. Around 11.2 million American nomads work for employers, while 7.3 million operate as independent freelancers. That employer number is worth noting. A big chunk of the nomad population didn’t quit their jobs. They just took those jobs on the road.
IT and tech lead the nomad workforce by population share, accounting for about 19% of all nomads. Creative and media roles follow at 14%. Education, marketing and finance each sit in the 8–9% range, with consulting at around 7%.
Industry | Nomad Share |
IT / Tech | ~19% |
Creative / Media | ~14% |
Education | ~9% |
Marketing | ~9% |
Finance | ~8% |
Consulting | ~7% |
Tech and finance tend to command the highest salaries across the board, which lines up with why the average nomad income sits as high as it does. If you work in either of those fields, the financial case for going nomad is easier to make.
Resources: Statista, Mbopartners, Nomadlist, Localyze

Budget is one of the biggest factors that shapes where nomads end up. The gap between the cheapest and most expensive destinations is wider than most people realize.
Southeast Asia, Latin America and Eastern Europe consistently top the affordability charts. Numbeo’s 2026 Cost of Living Index, with New York set at 100, puts Bangkok at just 41.4 and Mexico City at 45.9. Smaller cities like Phnom Penh in Cambodia and Niš in Serbia sit even lower, in the high 30s.
Portugal and Estonia also draw nomads on tighter budgets. Portugal offers strong quality of life at costs well below Western Europe, and Estonia is notably affordable compared to its EU neighbors.
On the other end of the scale, Western European and North American cities can stretch a nomad budget fast. Zurich tops Numbeo’s 2026 index at 118.5, with Geneva close behind at 116.5. New York sits at 100 by definition, and London comes in at around 87.5.
San Francisco hovers near 97.6, putting it just below New York. These cities still attract nomads who work in finance or tech and earn salaries that absorb the higher costs, but they’re the exception rather than the rule.
Housing eats up the biggest slice of a nomad’s budget. One cost model shows accommodation accounts for roughly 44% of total monthly spend, followed by utilities and internet at 18%, groceries at 14% and eating out at around 9%.
Expense Category | Budget Share |
Accommodation | ~44% |
Utilities / Internet | ~18% |
Groceries | ~14% |
Eating Out | ~9% |
That breakdown means rent differences hit the hardest. Lisbon’s overall cost index sits at around 54.2, with rent at 38.6. Bangkok’s total comes in at 41.4, with rent at just 19.6. For nomads watching their monthly burn rate, choosing Bangkok over Lisbon can free up a significant chunk of income every single month.
The rent gap between nomad-friendly cities and major Western metros is dramatic. Numbeo’s 2026 Rent Index, again with New York at 100, shows Bangkok at 19.6, Mexico City at 28.1 and Lisbon at 38.6. Zurich sits at 70.6.
City | Rent Index |
Bangkok | ~19.6 |
Mexico City | ~28.1 |
Lisbon | ~38.6 |
Zurich | ~70.6 |
New York | 100 |
To put that in real terms, a one-bedroom apartment that costs $2,000 a month in New York or London can often be found for $300 to $500 in Bangkok or Hanoi. For nomads, that gap is what makes the math work.
A good internet isn’t a perk for digital nomads. It’s a requirement. The data on connectivity and remote work tools shows how the infrastructure around nomadism has matured.
Most top nomad destinations now deliver solid, reliable internet. Nomad List’s 2025 data shows median download speeds for popular nomad countries in the 40 to 60 Mbps range. South Korea leads at around 57 Mbps, followed by Hungary at 54, Switzerland at 51 and Spain at 50.
Country | Median Speed |
South Korea | ~57 Mbps |
Hungary | ~54 Mbps |
Switzerland | ~51 Mbps |
Spain | ~50 Mbps |
Portugal | ~44 Mbps |
Some cities go well beyond that range. Toulouse clocks in at around 128 Mbps, Dallas at 110 and Utrecht at 106. For video calls, large file transfers and cloud-heavy workflows, those speeds make a real difference.
The global coworking market has scaled up fast. By the end of 2024, there were roughly 42,000 coworking locations worldwide. That number keeps climbing.
Region | Key Stat |
Global | ~42,000 spaces |
United States | ~9,136 spaces |
UK / Ireland | ~4,550 spaces |
London alone | ~1,209 spaces |
Asia-Pacific is the fastest-growing market, led by India, China, Japan and Australia. The UAE has expanded its coworking sector aggressively through government incentives. Demand isn’t just coming from freelancers either. Companies with distributed teams are also snapping up coworking memberships, which is pushing supply higher across every major region.
The toolstack for remote work has become remarkably consistent. About 80% of remote workers rely on instant messaging apps like Slack or Microsoft Teams. Team collaboration platforms, including Zoom and Google Meet, are used by around 79%. Cloud storage and file-sharing tools like Dropbox and Google Drive come in at 74%.
These numbers come from broad remote-work studies, but they apply directly to the nomad population. A nomad in Bangkok and a remote employee in Chicago are likely running the same tools. The workflow has become standardized in a way that makes location almost irrelevant.
Resources: Nomadlist, Statista, Mbopartners, Pumble, Coworker
Digital nomadism has moved well past a niche lifestyle. The data makes that clear. Millions of workers across every age group, nationality and income level have cut the cord from a fixed office. The numbers will keep shifting, so bookmark this page and check back for updates.
You are currently viewing a placeholder content from Calendly. To access the actual content, click the button below. Please note that doing so will share data with third-party providers.
More InformationYou are currently viewing a placeholder content from Calendly. To access the actual content, click the button below. Please note that doing so will share data with third-party providers.
More InformationYou need to load content from reCAPTCHA to submit the form. Please note that doing so will share data with third-party providers.
More InformationYou are currently viewing a placeholder content from Turnstile. To access the actual content, click the button below. Please note that doing so will share data with third-party providers.
More InformationYou are currently viewing a placeholder content from Vimeo. To access the actual content, click the button below. Please note that doing so will share data with third-party providers.
More InformationYou need to load content from reCAPTCHA to submit the form. Please note that doing so will share data with third-party providers.
More InformationYou are currently viewing a placeholder content from Elfsight. To access the actual content, click the button below. Please note that doing so will share data with third-party providers.
More InformationYou are currently viewing a placeholder content from reCAPTCHA. To access the actual content, click the button below. Please note that doing so will share data with third-party providers.
More Information