Employee referrals don’t make up much of the applicant pool, but they punch well above their weight. Referrals account for just 6-7% of total job applicants, yet they drive 30-50% of all hires across U.S. companies. That gap alone shows why so many hiring teams now lean on referral programs instead of relying only on job boards or open postings.
The referral funnel backs this up with hard numbers too. Out of every 10 candidates who get referred, 8 respond, 6 go on to apply, 4 reach an interview, and 1 ends up hired. That means roughly 40% of referred candidates make it all the way to the hiring manager stage, a rate most other sourcing channels can’t come close to matching.
Conversion numbers tell the same story from a different angle. Referred applicants convert to hires at 28-34%, compared to just 2-7% for candidates who apply without one. The gap widens even further at senior levels, where referred candidates land offers at 1 in 16, versus 1 in 100 for job-board applicants. Keep reading to see how these numbers break down by year, company size, region, and job function.

Author
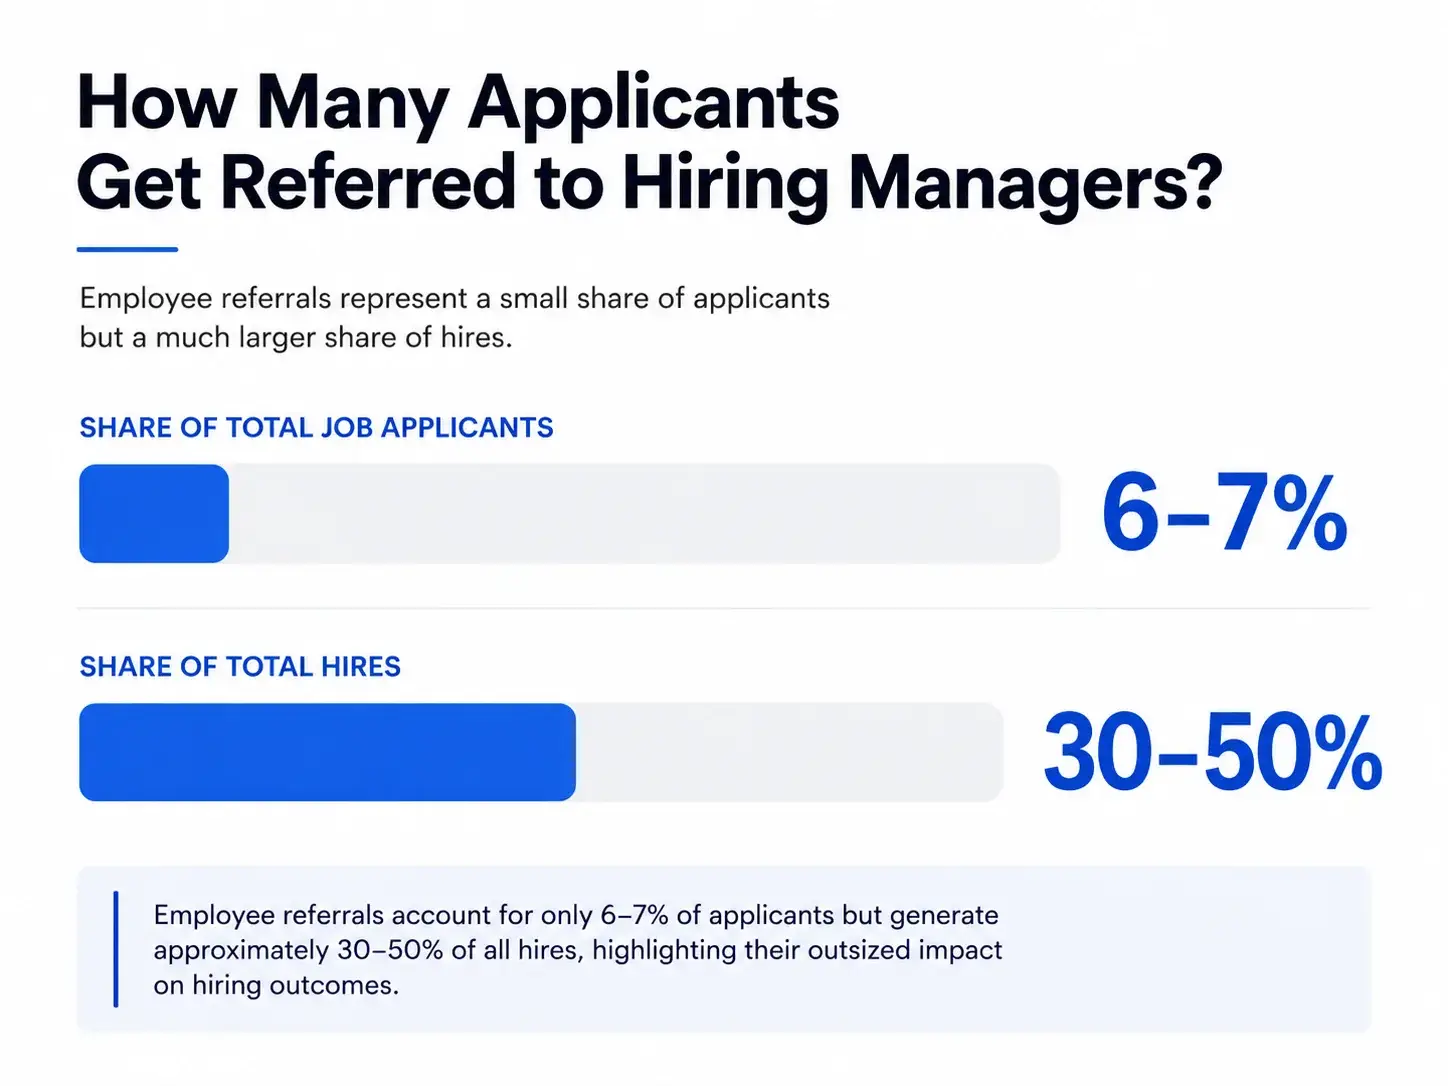
Employee referrals don’t make up much of the applicant pool, but they punch well above their weight. Referrals account for just 6-7% of total job applicants, yet they drive 30-50% of all hires across U.S. companies. That gap alone shows why so many hiring teams now lean on referral programs instead of relying only on job boards or open postings.
The referral funnel backs this up with hard numbers too. Out of every 10 candidates who get referred, 8 respond, 6 go on to apply, 4 reach an interview, and 1 ends up hired. That means roughly 40% of referred candidates make it all the way to the hiring manager stage, a rate most other sourcing channels can’t come close to matching.
Conversion numbers tell the same story from a different angle. Referred applicants convert to hires at 28-34%, compared to just 2-7% for candidates who apply without one. The gap widens even further at senior levels, where referred candidates land offers at 1 in 16, versus 1 in 100 for job-board applicants. Keep reading to see how these numbers break down by year, company size, region, and job function.
Author
Referred candidates convert to interviews and hires at rates that leave every other sourcing channel far behind. The numbers below break down how this trend built up over the years and where it stands today.

Year | Employee Referral Hiring Statistics |
2013 | Referral schemes filled about 13% of vacancies in surveyed UK organizations. |
2016 | Internal hires were ranked the highest-quality source (38%), followed by employee referrals (34%). Around 64% of recruiters offered monetary referral bonuses. |
2020 | About 65% of surveyed workers had never participated in a company referral program, although 79% of organizations offered one. |
2022 | 40% of external hires came from employee referrals, making referrals the largest hiring source, while job boards accounted for just 11% of hires. |
2023 | 30%–50% of U.S. workers were hired through employee referrals. About 45% of companies identified referrals as their primary hiring source. |
2024 | Referral hires accounted for 17% of all hires at companies with fewer than 1,000 employees and 14% at companies with 1,001–5,000 employees. ERIN processed 1.1+ million referrals, resulting in 146,689 hires (a 13% placement rate). |
2026 | Employee referrals account for approximately 30%–33% of total hires globally, while the U.S. referral hire share reaches 35%. |
Referral programs didn’t become a hiring staple overnight. Adoption crept up slowly, then picked up speed once companies noticed the payoff in retention and speed to hire.
Referrals make up only 6-7% of total applicants, yet they account for 30-50% of all hires in the U.S. A referred candidate is 4-5 times more likely to land a job than someone who applies through a job board.
Despite their small share of applicants, referred candidates fill about 72% of all interview slots. Apply-to-hire conversion for referrals runs between 28.2% and 34%, while job board conversion typically stays stuck at 2-5%.
Remote work reshaped how companies fill roles, and referrals felt the impact too. Remote arrangements grew from about 27% of employees in May 2020 to nearly 45% by early 2021, then held steady near 45-50% through 2024.
A dataset covering 38 million applications between 2021 and 2024 found something unexpected though. Referral-based applications actually dropped, falling from about 2% in Q1 2021 to under 1% by Q1 2024, even as total inbound applications climbed. Digital and inbound sourcing simply scaled up faster than referral pipelines did.
Even so, referral hire share held firm in the 11-17% range across large small business datasets during this same stretch. CareerPlug’s review of over 10 million applications from 60,000+ small businesses found referrals made up just 2% of applicants but delivered 11% of all hires in 2024. The conversion advantage carried referrals through, even as their application volume shrank.
Referral reliance has grown 37% globally since 2017, though the pace varies a lot by region. North America led the way with a 52% rise, Europe followed at 42%, and Asia-Pacific grew a more modest 19% over the same stretch.
By 2024, somewhere between 71% and 87% of U.S. employers ran some kind of referral program, up from 79% in 2021. Across multiple survey years, referred candidates consistently landed jobs at 28.5-34% rates, compared to just 2-7% for candidates who applied without one.
Industry trackers expect referral share to keep climbing through 2027 and into 2030. LinkedIn Talent Insights puts the 2026 benchmark at 33% of total hires, and referral hires stick around longer too, with 89% retention at 24 months versus 71% for non-referrals.
AI-assisted referral nudges are starting to show up as a growth driver, especially at enterprise companies. That said, no verified numeric projection exists yet for 2027 or 2030 specifically. The 2026 benchmark remains the most recent confirmed figure available.
Sources: Zippia, Boterview, Hellora, Sci-tech-today, Onehour, Cadient, Personneltoday, Jobvite, Nber, Staffinghub, Expertbeacon, Erinapp, Gitnux,
Company size plays a huge role in how much a referral program actually delivers. Smaller teams tend to lean on personal networks far more than large enterprises do.
Startups under 200 employees post the highest referral hiring rate of any segment out there. Referrals fill 50-70% of roles at this stage. Small teams, high-stakes hiring, and founders tapping their own networks all drive this number up.
Companies under 1,000 employees see about 16-17% of hires come through referrals. Some benchmark sources push that figure even higher, citing up to 43% of hires with a 55% employee participation rate. Firms aged 0-20 years, which tend to skew smaller, rely on referrals for nearly 30% of hires.
Firms with 1,001-5,000 employees pull about 12-14% of hires from referrals, with participation sitting around 38%. Interestingly, companies in the 500-1,000 employee range post the lowest referral rate of any size band, at just 22%.

Large organizations with 10,000 to 50,000+ employees see referral share taper down to 9-12% of hires, with participation around 22%. At this scale, roughly 1 in 10 referrals turns into an actual hire. The funnel looks like this: out of 10 candidates who get a referral notice, 8 respond, 6 apply, 4 interview, and 1 gets hired.
Sources: Insidetrackjobs, Erinapp,, Electroiq,, Wifitalents, Shrm
Referral reliance shifts a lot depending on the industry. Some sectors lean on personal networks heavily, while others stay bound by strict hiring rules.

Tech firms top every industry for referral reliance, with 38-50% of hires coming through referrals and an average time-to-fill of just 24 days. Referral bonuses in tech average $2,400-$4,500, the highest across any sector tracked. One 2026 benchmark puts tech referral hires at 40% specifically.

Healthcare referral share runs lower, between 27% and 32%, mostly because credential-heavy hiring and licensing requirements slow things down. Still, healthcare pays the highest average referral bonus of any industry, at $2,800-$3,800, which reflects how badly employers need specialized talent.
Finance sees a referral share of 30-45% of hires. One dataset pegs referrals at 39% of external hires in the sector, with 92% retention after two years. Compliance-heavy culture and high switching costs both push referral reliance up here.
Retail referral shares swing widely, from 22% for standard hiring up to 42% during seasonal spikes. High-volume roles that need less specialization tend to lower individual referral incentive, and bonuses stay modest at $500-$1,500.
Manufacturing referral rates land between 15% and 25% of hires, shaped heavily by union hiring halls and skilled-trade apprenticeship pipelines. Construction-specific referral bonuses climb as high as $3,000-$3,200.
Government and public sector hiring shows the lowest referral reliance of any industry, sitting at just 5-15% of hires. Mandated open-application rules and civil-service compliance requirements keep this number down.
Sources: Insidetrackjobs, Wifitalents, Boterview, Hellora, Erinapp, Expertbeacon

| Region | Referral Share of Hires (2026) | Avg. Time-to-Fill | 24-Month Retention |
| United States | 35% | 27 days | 90% |
| Canada | 32% | 29 days | 88% |
| United Kingdom | 28% | 31 days | 84% |
| Germany (Europe) | 25% | 33 days | 82% |
| Australia (APAC proxy) | 30% | 30 days | 86% |
Referral hiring looks completely different depending on where you sit on the map. Here’s how the numbers stack up across the world’s major markets.
The U.S. tops every global market with a 35% referral share of hires in 2026. Time-to-fill averages just 27 days, and retention hits 90% at the 24-month mark. Referrals have long made up 30-50% of all new hires despite representing only about 7% of total applicants. Somewhere between 71% and 87% of U.S. employers now run a formal referral program.
Canada trails the U.S. slightly, sitting at a 32% referral share of hires in 2026. Time-to-fill runs a bit longer at 29 days, and 24-month retention lands at 88%. That puts Canada just behind the U.S. among reported markets.
The UK posted a 28% referral share of hires in 2026, according to SHRM’s global report. Time-to-fill averages 31 days, with 84% retention after 24 months. Looking back, UK referral schemes filled just 13% of vacancies in 2013, so growth here has been substantial over the past decade.
Germany serves as the benchmark for the wider European market, with a 25% referral share of hires in 2026. Time-to-fill runs 33 days, and retention sits at 82%, the lowest among developed markets tracked. That said, referral reliance across Europe overall grew 42% since 2017, so the trend is still moving upward.
Asia-Pacific grew more slowly, with referral reliance up just 19% since 2017, compared to 52% in North America and 42% in Europe. Australia stands in as the regional benchmark, posting a 30% referral share of hires and 86% retention at 24 months in 2026. No verified country-specific data exists yet for markets like India, Singapore, or Japan, so this remains a gap worth watching.
No verifiable, publicly sourced data on referral hiring rates turned up for this region across major industry reports, including Jobvite, SHRM, LinkedIn, ERIN, Hellora, and Cadient. This stands as a confirmed data gap for now.
Sources: Cadient, Expertbeacon, Personneltoday, Zippia

Referral hiring doesn’t hit every age group or seniority level the same way. Younger workers and senior roles both lean on referrals more than most people would guess.
By age, U.S. referral hire share breaks down like this: 18-24 years old make up 30%, 25-34 year olds lead at 35%, 35-44 year olds sit at 25%, 45-54 year olds drop to 15%, and workers 55 and up land at just 10%.
Seniority tells a similar story. Referral rates climb steadily as roles get more senior. Entry-level positions see about 20% referral hiring, mid-level roles bump up to 30%, senior and director roles reach roughly 40%, and VP-and-above roles cross 60%. Most executive roles get filled through personal networks or search firms before they’re ever posted publicly.
For senior positions specifically, 1 in 16 referred candidates gets hired, compared to just 1 in 100 for job-board applicants. That gap alone shows why networks matter more at the top.
Referral pipelines don’t perform the same across every role. Technical and revenue-driving functions pull in candidates through referrals far more than support-heavy roles do.

Top tech employers fill up to 60% of engineering roles through referrals, the highest function-specific rate found in any dataset. Engineering also drives the largest referral interview pipeline of any function, at 32%. Across the broader tech sector, referral hiring runs at 38-50% of total hires, with an average time-to-fill of just 24 days.
Sales ranks as the top function for referral-based hiring, according to Gitnux 2026 data, though no exact referral percentage exists yet for this function specifically. This tracks with how relationship-driven, quota-based roles tend to favor pre-vetted candidates who come recommended.
As a rough stand-in, best-in-class companies attribute 30-35% of external hires to referrals company-wide, which likely extends to HR hiring as well.
As a proxy, high-volume roles that need less specialization, similar to standard retail hiring at 22% referral share, tend to lean on referrals less than specialized functions do.
Referral programs do deliver 2-3x more pipeline volume for what’s labeled “critical roles,” a category grouped alongside engineering, so operations-critical positions likely see similar benefits.

Referrals don’t just outperform job boards. They beat out nearly every other sourcing channel companies rely on, from recruiters to campus programs.
Job boards produced 61% of all applications in 2024 but only converted to 42% of hires. Referrals flipped that ratio entirely, making up just 2% of applicants while producing 11% of hires.
That makes referred candidates roughly ten times more likely to get hired than someone who applied through a job board. Career pages performed better than job boards too, generating 13% of applicants but 26% of hires, putting career-page applicants at about four times more likely to land the job, though still behind referrals. Back in 2016, Indeed alone accounted for two-thirds of external hires and nearly 72% of external interviews, while referrals still delivered over 30% of overall hires that same year.
Recruiter-sourced hires made up about 19% of internal-source hires in SilkRoad’s 2016 benchmark. Referrals crushed that number, delivering 45% of internal hires and over 30% of hires overall that year. Cost tells a similar story. Recruitment agencies typically charge 20-30% of a worker’s annual salary, while a referral bonus runs just 2-3% by comparison.
Internal moves like promotions and transfers made up 21% of internal-source hires in 2016, while referrals contributed 45%. Combined, internal sources produced 52% of all hires that year, edging out external sources at 48%. Internal mobility itself grew about 30% between 2021 and 2024, and companies with strong internal mobility retain employees 41% longer than those without it. SmartRecruiters’ 2025 benchmark put referral share of global hires at 7-8%, with healthcare reaching 20% and manufacturing landing at 14%.
Referrals rank well ahead of campus and university recruiting as a hiring source. One dataset places referrals from colleges and universities at just 10% share, well behind broader employee referrals overall.

Referrals don’t just convert better. They move through the hiring pipeline noticeably faster at every single stage.
Referred candidates get their resume reviewed by an actual human about 95% of the time, compared to just 25% for cold applicants. Referral hiring saves recruiting teams roughly 20 hours per week in screening time and cuts 13 days off the sourcing stage compared to non-referred candidates.
Referral programs cut hiring manager review time by 50% compared to standard candidate review. Phone screens get scheduled for about 50-60% of referred candidates, versus only 10-15% of cold applicants.
Interviewing a referral takes about 25% less time than interviewing an unknown candidate. Referred candidates reach the final interview stage at roughly 40%, while cold applicants manage just 5-8%.
Referred candidates have a 15-20% shot at receiving an offer, compared to just 1-3% for cold applicants. That works out to offer odds of about 1-in-5 to 1-in-7 for referrals, versus 1-in-33 to 1-in-100 for cold applicants. Offer acceptance runs higher for referrals too, at around 90% versus 70% for cold applicants.
Referral hires close in an average of 22-29 days, compared to 37-55 days for non-referral sources, a gap of roughly 13-33 days depending on the dataset. ERIN’s 2026 enterprise data cites 22 days to hire a referral versus 37 days for other sources, saving about $3,500 per referral hire. LinkedIn Talent Solutions found similar numbers in 2024, with referral time-to-hire at 23 days versus 42 days for the job-board average.
Sources: Wifitalents, Erinapp, Insidetrackjobs, Cadient
Referral hires don’t just come in faster. They stick around longer and perform better once they’re actually on the job.

Referral hires convert from interview to hire at about 40%, well above what job-board interviews typically manage. ERIN’s enterprise data breaks the funnel down clearly. Out of every 10 candidates who receive a referral, 8 respond, 6 apply, 4 interview, and 1 gets hired.
Referred candidates accept job offers at rates 2.6% to 6.6% higher than non-referred candidates. LinkedIn Talent Solutions puts referral offer-acceptance at 85%, compared to 75% for job-board hires. Other benchmark data shows a similar pattern, with referrals seeing a 15% bump in acceptance rates overall.
Referral hires stick around longer no matter which time frame you look at. One-year retention sits at 71-82% for referrals versus 54-71% for other sources. That gap widens further out. Three-year retention runs 46-47% for referrals compared to just 14-25% for job-board hires, and four-year retention holds at 45% for referrals versus 25% for job-board hires. Hellora’s 2026 platform data shows the advantage kicks in early too, with referral hires posting 96% retention at 30 days, 92% at 60 days, and 87.7% at 90 days.
Referral hires outscore non-referral hires by 26% on first-year performance, according to 2026 Cadient data. A separate study found referred employees pull in 11% higher performance reviews on average. They also ramp up faster, reaching full productivity about 2 months sooner and hitting productivity targets 33% faster than non-referred hires.
Referrals hold up well against every other major sourcing channel, whether you’re looking at speed, cost, or how the funnel actually plays out.
At enterprise scale, about 1 in 10 referrals turns into a hire. For senior roles that ratio tightens even further, with 1 in 16 referred candidates getting hired, compared to just 1 in 100 for job-board applicants. Job boards often need 50-60 or more applicants screened per hire, while the referral funnel stays far more concentrated: 8 of 10 respond, 6 apply, 4 interview, and 1 gets hired.

Referral hires close positions in about 29 days on average, compared to 39-45 days for candidates sourced through career websites. Career sites convert applications at just 7-10%, while 84.2% of candidates who accept a referral invitation go on to actually apply.
Recruitment agencies typically charge 20-30% of a new hire’s annual salary in fees. Referral bonuses cost just 2-3% of salary by comparison, roughly a 10x difference. Factor in retention and performance gains, and referral hires end up 6-10x more cost-effective overall than agency-sourced hires.
Direct referrals beat social-media-shared referrals by a wide margin. In ERIN’s 2024 dataset, 30% of all referrals got shared over social media, yet only 14% of resulting hires came from that channel. The rest came through direct email or portal referrals instead, showing that social sharing converts at a noticeably lower rate than direct, person-to-person referral paths.
Sources: Shrm, Wifitalents, Truestephr, Llcbuddy, Hrref, Cadient
Employee referrals consistently outperform every other hiring channel, from conversion rates to retention and speed. As referral share keeps climbing toward 2026 and beyond, building a strong referral program isn’t optional anymore. It’s essential.
You are currently viewing a placeholder content from Calendly. To access the actual content, click the button below. Please note that doing so will share data with third-party providers.
More InformationYou are currently viewing a placeholder content from Calendly. To access the actual content, click the button below. Please note that doing so will share data with third-party providers.
More InformationYou need to load content from reCAPTCHA to submit the form. Please note that doing so will share data with third-party providers.
More InformationYou are currently viewing a placeholder content from Turnstile. To access the actual content, click the button below. Please note that doing so will share data with third-party providers.
More InformationYou are currently viewing a placeholder content from Vimeo. To access the actual content, click the button below. Please note that doing so will share data with third-party providers.
More InformationYou need to load content from reCAPTCHA to submit the form. Please note that doing so will share data with third-party providers.
More InformationYou are currently viewing a placeholder content from reCAPTCHA. To access the actual content, click the button below. Please note that doing so will share data with third-party providers.
More Information