AI is changing jobs faster than most people expected, but the headlines rarely tell the full story. Numbers like “92 million jobs displaced” or “800 million workers affected” get thrown around without context on timeframes, sources, or what they actually measure.
This post breaks down the real data on which jobs face the highest risk by 2030, which roles are proving more resilient than expected, and where new opportunities are emerging as a result of AI adoption.
Every figure below comes from a named source (WEF, McKinsey, ILO, BLS, and others) so you can see exactly what’s being measured and avoid mixing up task automation with actual job loss.

Author

AI is changing jobs faster than most people expected, but the headlines rarely tell the full story. Numbers like “92 million jobs displaced” or “800 million workers affected” get thrown around without context on timeframes, sources, or what they actually measure.
This post breaks down the real data on which jobs face the highest risk by 2030, which roles are proving more resilient than expected, and where new opportunities are emerging as a result of AI adoption.
Every figure below comes from a named source (WEF, McKinsey, ILO, BLS, and others) so you can see exactly what’s being measured and avoid mixing up task automation with actual job loss.
Author

WEF forecasts displacement equivalent to 8% of current employment by 2030. Its forecast covers technological, economic, demographic, and other structural changes, not AI alone.
The report draws on more than 1,000 employers across 55 countries, representing over 14 million workers.
McKinsey’s earlier automation scenarios produce larger estimates because they use different assumptions and a broader automation framework.
Forecast | Potential displacement by 2030 | Scope |
WEF, 2025 report | 92 million jobs | Multiple structural trends |
McKinsey, 2017 midpoint scenario | About 400 million workers | Automation adoption |
McKinsey, fastest scenario | About 800 million workers | Faster automation adoption |
These estimates are alternative scenarios. They should not be added together or presented as confirmed layoffs.
WEF projects a net gain of 78 million jobs by 2030 after accounting for creation and displacement.
Technology’s effects also differ. AI and information processing have a positive projected net employment effect, while robots and autonomous systems could produce a net decline of 4.8 million jobs.
Net growth does not mean displaced workers automatically qualify for newly created positions.
ILO estimates that 34% of employment in high-income countries has some GenAI exposure, compared with approximately 10% in low-income economies.
Under McKinsey’s rapid-adoption scenario, as many as 375 million workers, or 14% of the global workforce, could need to change occupational categories by 2030.
Exposure measures potential changes to work. Occupational transitions measure movement between job categories.
WEF identifies broadening digital access, AI, robotics, aging populations, and slower economic growth among the forces reshaping employment.
The forecast therefore includes changes from digital banking, self-service transactions, industrial machinery, and demographic demand alongside generative AI.

Agriculture employed 41% of the US workforce in 1900, falling to approximately 2% by 2000 as machinery reduced labor requirements.
Agricultural output nevertheless more than tripled. Employment decline within an industry can therefore occur alongside rising production.
US ATM numbers rose from approximately 100,000 in 1995 to 400,000 in 2010. Bank teller employment initially remained resilient as lower operating costs supported branch expansion.
Later, online and mobile banking reduced demand for branch transactions. Only 9% of customers identified branches as their primary banking channel in 2025, compared with 36% in 2007.
McKinsey’s 2017 research estimated that approximately half of paid work activities worldwide could technically be automated using technology available at the time.
That estimate concerned activities within jobs. Technical feasibility did not establish how quickly employers would adopt automation or how many positions would disappear.
The supplied enterprise research reports AI deployment at 72% of enterprises in 2026, compared with 55% in 2024.
Adoption measures vary across surveys: using an AI tool, deploying a production workload, and automating a complete process are different thresholds. None directly measures workforce reduction.
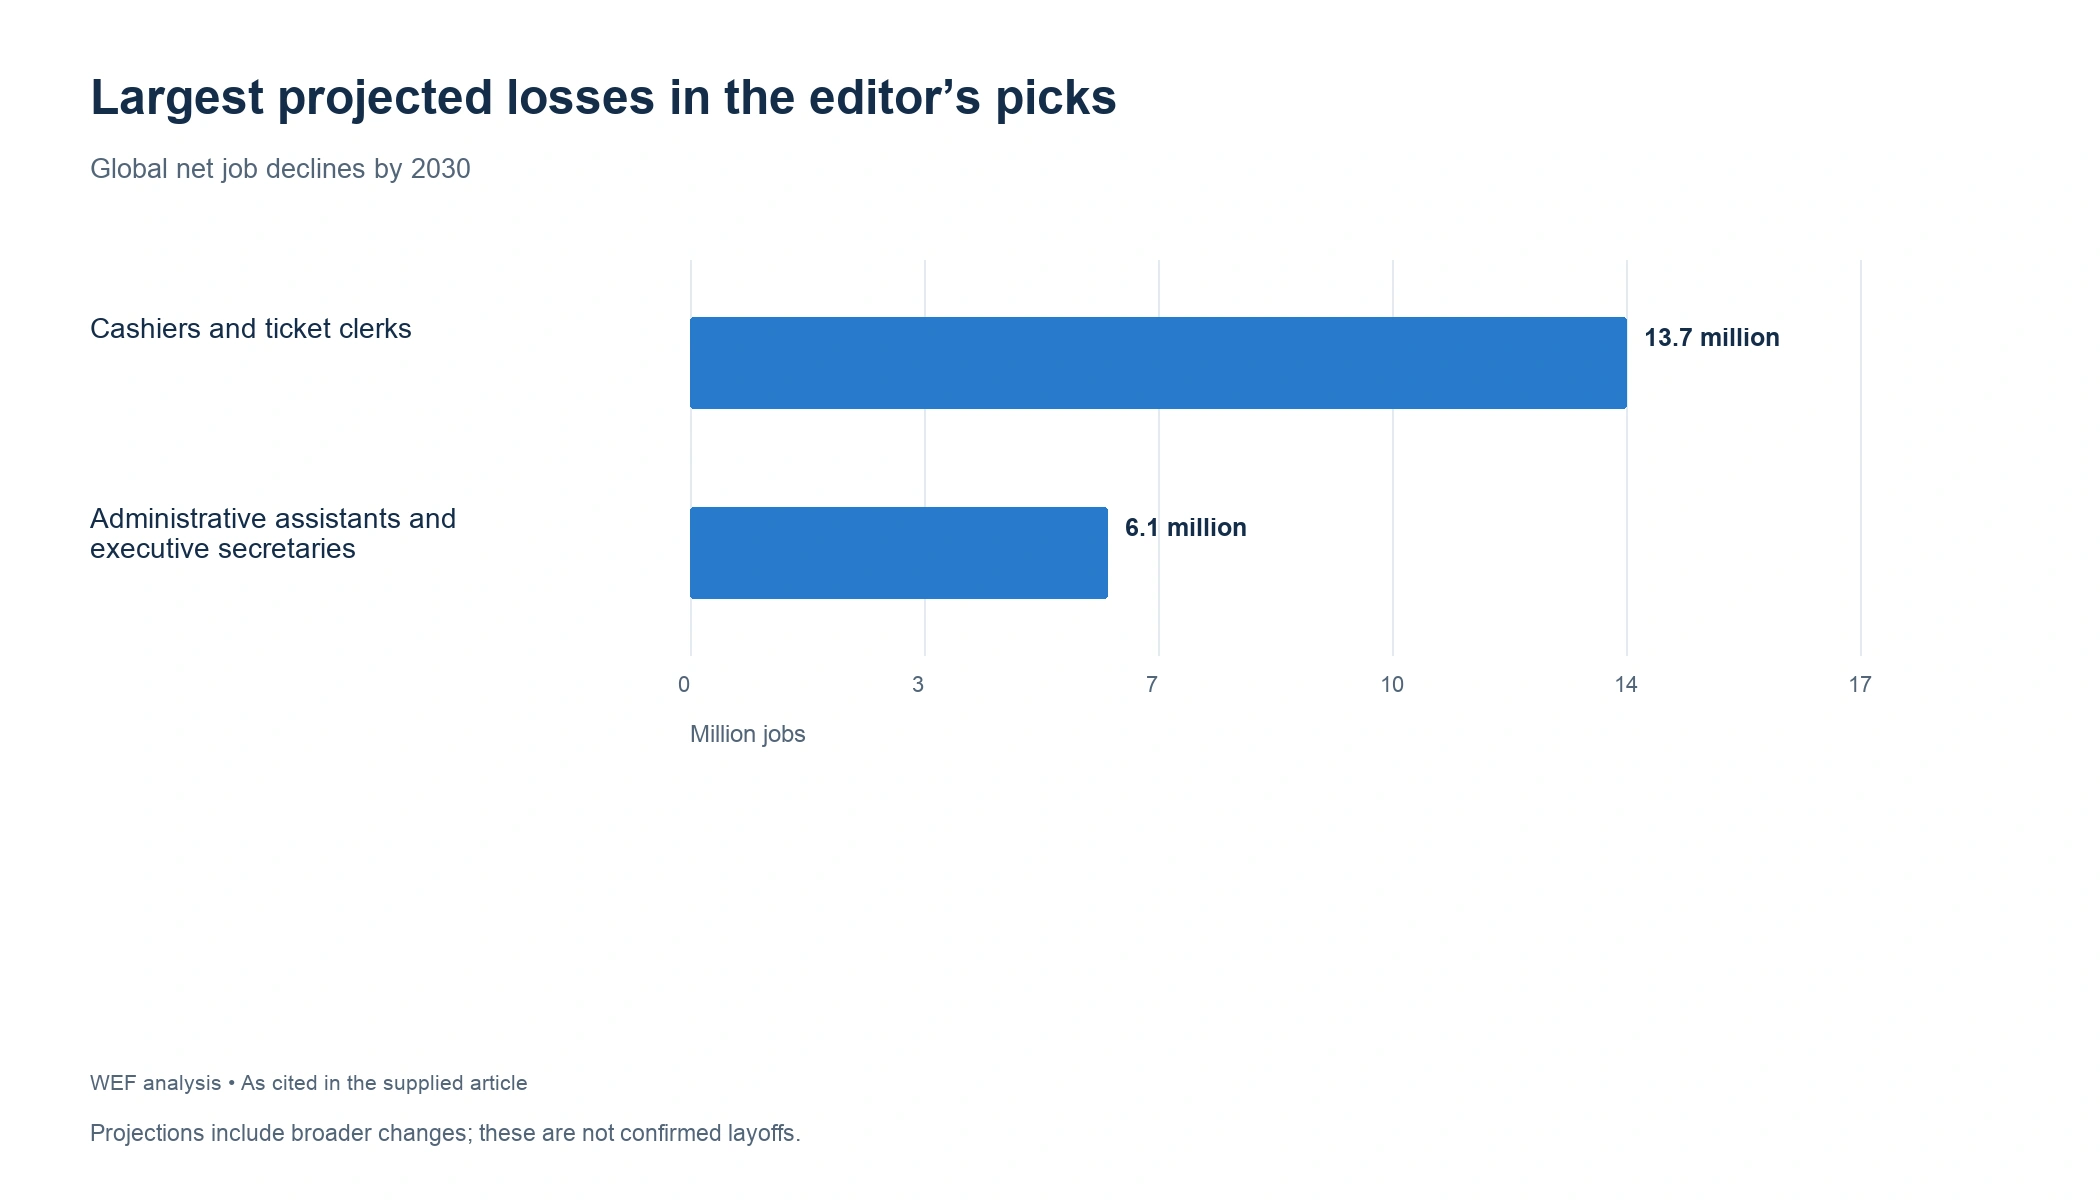
Administrative assistants and executive secretaries face a projected net loss of 6.1 million jobs globally by 2030, according to the supplied analysis of WEF findings.
Scheduling, document preparation, data processing, and recordkeeping place routine office work among the most exposed categories.
Cashiers and ticket clerks face a projected net decline of 13.7 million positions by 2030 in the supplied WEF analysis.
Self-checkout, digital payments, and electronic ticketing contribute to this pressure. These technologies extend beyond generative AI.
Citigroup’s estimate, summarized in the research, places 54% of banking jobs at high automation potential, with another 12% potentially augmented.
Separately, ThoughtLinks models substantial changes to banking work:
Banking segment | Work potentially redefined by AI by 2030 |
Commercial banking | 49% |
Wealth management | 42% |
Investment banking | 33% |
These percentages describe work affected, not equivalent reductions in employee headcount.
Deloitte and the Manufacturing Institute project that up to 2.1 million US manufacturing jobs could remain unfilled by 2030 because of skills shortages.
Manufacturing can experience automation pressure and labor shortages simultaneously. Routine production tasks and technical maintenance positions have different employment outlooks.
WEF places graphic designers 11th among the fastest-declining occupations in its 2025 outlook.
However, a Clutch survey summarized in the research found that only 18% of businesses reported reduced need for human designers, despite 88% using AI design tools.
Sources: Interview Guys, JobsData, BI, Relling, Waystone, Zekai
No authoritative source establishes that 100 specific jobs will be replaced by 2030. The following compilation covers roles exposed to AI, broader automation, or declining employment demand.
Numbering is for navigation, not risk ranking. Some entries overlap or identify specialties within a broader occupation. Several professions may grow overall while their routine tasks become automated.
No. | Job or role |
1 | Data entry clerks and keyers |
2 | Word processors and typists |
3 | File clerks |
4 | Payroll and timekeeping clerks |
5 | Order clerks |
6 | Switchboard operators |
7 | Telephone operators |
8 | Office machine operators, except computer |
9 | Postal service clerks |
10 | Bank tellers and related clerks |
11 | Administrative assistants and executive secretaries |
12 | Material-recording and stock-keeping clerks |
13 | Statistical, finance, and insurance clerks |
14 | General office clerks |
15 | Legal secretaries |
16 | Executive assistants |
17 | Procurement clerks |
18 | Virtual administrative assistants |
19 | Medical scribes |
20 | Meter readers |
21 | Insurance claims and policy-processing clerks |
22 | Desktop publishers |
23 | Court transcription and office-machine roles |
24 | Transportation attendants and conductors |
25 | Door-to-door sales workers, news vendors, and street vendors |
No. | Job or role |
26 | Cashiers and ticket clerks |
27 | Tier 1 customer service representatives |
28 | Telemarketers |
29 | Receptionists |
30 | Retail sales associates |
31 | Ticket agents and travel agents |
32 | Insurance agents handling routine policy sales |
33 | Loan officers |
34 | Credit analysts |
35 | Market research analysts |
36 | Real estate appraisers |
37 | Insurance underwriters |
38 | Real estate agents handling routine transactions |
39 | Delivery drivers |
40 | Long-haul truck drivers |
41 | Warehouse picking and packing workers |
42 | Claims adjusters and examiners |
43 | Bank branch support staff |
44 | Retail checkout staff |
45 | Street and door-to-door vendors |
46 | Interpreters and translators handling routine material |
47 | Proofreaders and copy markers |
48 | Tax preparers |
49 | Compliance clerks handling routine monitoring |
50 | Postal and mail-sorting workers |
No. | Job or role |
51 | Accounting, bookkeeping, and payroll clerks |
52 | Bookkeepers |
53 | Accountants and auditors |
54 | Entry-level financial analysts |
55 | Paralegals |
56 | Legal secretaries and administrative assistants |
57 | Billing and posting clerks |
58 | Real estate appraisers and assessors |
59 | Personal and business property appraisers |
60 | Financial quantitative analysts |
61 | Middle managers overseeing routine administration |
62 | HR generalists handling routine screening |
63 | Business analysts |
64 | Compliance officers handling routine processes |
65 | Actuaries performing routine calculations |
66 | Investment bankers handling routine deal support |
67 | Commercial banking operations staff |
68 | Wealth management support staff |
69 | Biological technicians in data-heavy roles |
70 | Database administrators |
71 | Operations managers handling routine reporting |
72 | Supply chain managers handling routine planning |
73 | Corporate trainers focused on content delivery |
74 | Insurance policy-processing and underwriting support staff |
75 | Medical coders and billing specialists |
No. | Job or role |
76 | Graphic designers |
77 | Copywriters |
78 | Junior copywriters |
79 | Content marketers |
80 | Technical writers |
81 | Social media managers |
82 | Email marketing specialists |
83 | Video editors |
84 | Motion designers |
85 | Production and stock photographers |
86 | Journalists handling routine reporting |
87 | Printing and related trades workers |
88 | Prepress technicians and workers |
89 | Print binding and finishing workers |
90 | Instructional designers |
91 | Junior software and front-end developers |
92 | QA engineers handling routine testing |
93 | Paid media specialists |
94 | Content strategists focused on production |
95 | Podcast producers handling routine editing |
96 | Translators and localization specialists |
97 | Data engineers handling routine pipeline maintenance |
98 | Camera and photographic equipment repairers |
99 | Fabric and apparel patternmakers |
100 | Assembly-line and routine production workers |
Private occupational risk scores help identify potential exposure, but they are not validated probabilities of replacement. Inclusion here does not establish a job-loss deadline.
Sources: WEF, ILO, BLS, Displace Index, DQI, Blockonomi, ReplacedbAI, JobZone

ILO’s 2023 analysis classified 24% of clerical tasks as highly exposed to generative AI and another 58% as having medium exposure.
The supplied research also includes longer-term US employment projections. These extend beyond 2030 and cover all drivers of occupational decline.
US occupation | Projected decline, 2025–2035 |
Word processors and typists | 34.4% |
Telephone operators | 27.6% |
Switchboard operators | 26.0% |
Data entry keyers | 25.5% |
The supplied WEF analysis estimates an absolute decline of 1.65 million accounting, bookkeeping, and payroll clerk jobs globally by 2030.
For US payroll and timekeeping clerks, the research records a separate projected decline of 15.9% between 2025 and 2035.
WEF analysis reported by Euronews anticipates an approximately 20% decline in cashier and ticket clerk roles by 2030.
A large occupation can lose more positions in absolute terms than a smaller occupation with a steeper percentage decline.
US projections in the research show order clerk employment falling 17.5% and file clerk employment falling 15.8% between 2025 and 2035.
These forecasts provide longer-term context for the administrative contraction expected around 2030.
Printing faces pressure from digitization as well as automation.
US occupation | Projected decline, 2025–2035 |
Print binding and finishing workers | 17.5% |
Prepress technicians and workers | 15.3% |
Desktop publishers | 14.5% |
These are employment projections, not estimates of the percentage of workers AI alone will replace.
Sources: ILO, BLS, Interview Guys, Euronews
The supplied industry estimates put AI-generated code at approximately 41%–46% of code written by active developers in 2026.
This measures code production, not the proportion of developers replaced. Responsibilities increasingly include reviewing generated code, system architecture, security, and integration.
Routine reporting, ad optimization, and basic testing are among the marketing tasks being automated.
The research identifies emerging titles including AI marketing specialist, marketing automation manager, and AI workflow designer. It does not establish a reliable profession-wide replacement percentage.
US graphic designer employment is projected to grow 2% from 2024 to 2034, according to BLS figures summarized in the research.
This differs from WEF’s global decline outlook because the geography, forecast period, and methodology differ.
A Reuters Institute survey found that 67% of newsroom respondents reported no AI-related staff reductions, while 9% reported adding jobs.
Newsrooms use AI for drafting, headlines, and newsgathering support, with human staff retaining checking and editorial responsibilities.
The supplied research cites an estimate that 69% of paralegal tasks could be automated with current technology.
That task-level estimate does not imply equivalent job losses. Document review and routine research differ from courtroom representation, negotiation, and accountable legal judgment.
Sources: Dev, WebFX, HumanizeAI, RISJ, Higher Landing

The supplied research reports that AI handles approximately 30% of customer service cases, with a forecast of 50% by 2027.
The following measures capture different outcomes and should not be treated as a directly comparable ranking.
Function | Reported measure | What it measures |
Customer support | About 30% | Cases handled by AI |
Human resources | 39%–43% | Organizations using AI |
Finance and accounting | 42% | Activities technically automatable |
Procurement | 50%–80% | Tasks potentially automatable |
IT support | 40%–60% | Common tickets deflected |
AI adoption in HR rose from 26% of organizations in 2024 to the higher range reported for 2026.
Recruiting applications include job-description writing and resume screening. Adoption figures do not establish autonomous hiring or equivalent job cuts.
Robert Half reports 1.0% unemployment among accountants and auditors in the cited research.
Low unemployment can coexist with substantial automation potential when employers still require analysis, controls, and professional accountability.
KPMG simulations summarized by Suplari indicate substantial potential to automate procurement tasks.
Routine clerical processing faces greater pressure than supplier negotiation, category management, and sourcing strategy. Simulation results describe technical possibilities rather than observed displacement.
The supplied help-desk research reports 30%–50% lower cost per ticket when AI handles Tier 1 issues.
Ticket deflection measures requests resolved without conventional support handling. It does not measure the proportion of IT employees eliminated.

Stanford’s payroll-based research finds employment among 22–25-year-olds in highly AI-exposed occupations approximately 19% below the comparison trend.
The research attributes the gap mainly to reduced hiring rather than increased layoffs. This is a relative employment finding, not evidence that AI eliminated 19% of all young workers’ jobs.
The supplied Stanford research reports no comparable employment gap among workers aged 35–49 in highly exposed occupations.
Experience appears to provide some protection, although this finding does not establish that every mid-career occupation is secure.
Only 18% of workers aged 55–64 report feeling equipped to advance their AI skills, compared with approximately 29%–30% of workers under 40.
Research summarized in the notes also links highly exposed occupations to increased exits into unemployment among older workers.
The supplied 2026 research places unemployment among recent graduates aged 22–27 at approximately 5.6%–5.7%, above the 4.1%–4.3% range for all workers.
These labor-market figures describe outcomes; they do not isolate AI’s contribution from other hiring conditions.
Brookings research summarized in the notes identifies 15.6 million workers skilled through alternative routes in highly AI-exposed jobs.
Approximately 11 million hold “Gateway” roles, including customer service, secretarial work, and accounting support, positions that can provide access to higher-paying careers.

US healthcare and social assistance employment is projected to add approximately 2 million jobs between 2024 and 2034.
Home health and personal care aides account for 739,800 projected additional positions. These longer-term forecasts reflect demand for care rather than immunity from task automation.
The research cites a projected need for 130,000 additional trained electricians and 240,000 construction laborers by 2030 to support US AI data-center construction.
Construction demand does not guarantee permanent employment at each completed facility.
Robotics, controls, machine vision, and operational-technology security roles combine software knowledge with physical-system responsibilities.
AI can assist these workers, while installation, troubleshooting, and site-specific integration continue to require practical expertise.
A private study covering more than 55 manual professions assigns emergency services an average automation-risk score of approximately 11%.
That score is a model estimate, not a measured probability of job loss. Emergency work requires physical presence and responses to unpredictable conditions.
HEC research distinguishes automatable management tasks from leadership responsibilities.
Scheduling, monitoring, and routine compliance can receive AI support. Setting direction, managing crises, and maintaining accountable relationships remain different parts of the role.
Sources: BLS, WNY Labor, Talenbrium, Durable Careers, HEC

More than two-thirds of employers surveyed by WEF plan to hire for AI-specific roles.
AI and machine learning specialists rank among the fastest-growing occupations through 2030, alongside big data specialists and fintech engineers.
Research reported by Help Net Security found that cybersecurity job advertisements requesting AI skills doubled in G7 countries over a year.
Emerging specialties include AI security engineering, AI red teaming, and AI threat intelligence. Demand for these skills does not necessarily translate into equal opportunities at every experience level.
The supplied governance research reports that approximately 85% of AI governance postings target professionals with at least five years of experience.
These roles combine technical understanding with organizational oversight, risk assessment, and compliance responsibilities.
Talenbrium reports the following annual increases in job postings:
Role | Year-over-year posting growth |
Robotics and automation engineers | 33% |
Automation systems integrators | 29% |
Operational-technology/industrial-control security engineers | 41% |
Posting growth measures recruitment activity within the source’s coverage. It is not a forecast of total employment growth through 2030.
Deel hiring data summarized in the research shows 283% growth in cross-border hiring for general AI trainer roles in 2025.
Reported hourly pay ranges from approximately $20–$40 for general annotation to $100–$180 or more for specialist evaluation. These ranges cover different skill levels and should not be interpreted as guaranteed earnings.
The most useful employment statistics separate whole-job displacement from task automation and hiring changes. A shrinking occupation can still offer openings, while a growing profession can become harder to enter. For accurate citation, preserve each figure’s geography, forecast period, and underlying measure.
You are currently viewing a placeholder content from Calendly. To access the actual content, click the button below. Please note that doing so will share data with third-party providers.
More InformationYou are currently viewing a placeholder content from Calendly. To access the actual content, click the button below. Please note that doing so will share data with third-party providers.
More InformationYou need to load content from reCAPTCHA to submit the form. Please note that doing so will share data with third-party providers.
More InformationYou are currently viewing a placeholder content from Turnstile. To access the actual content, click the button below. Please note that doing so will share data with third-party providers.
More InformationYou are currently viewing a placeholder content from Vimeo. To access the actual content, click the button below. Please note that doing so will share data with third-party providers.
More InformationYou need to load content from reCAPTCHA to submit the form. Please note that doing so will share data with third-party providers.
More InformationYou are currently viewing a placeholder content from reCAPTCHA. To access the actual content, click the button below. Please note that doing so will share data with third-party providers.
More Information