Fake job candidate statistics cover several different problems: fabricated identities, false qualifications, résumé lies, proxy interviews, and concealed interview assistance. These behaviors can distort hiring decisions and give fraudulent workers access to company systems.
This article examines how many job candidates are fake using applicant datasets, candidate surveys, employer reports, and enforcement cases. Each statistic identifies what was measured so readers can distinguish confirmed fraud from suspected activity, ordinary inaccuracies, and forecasts.

Author

Fake job candidate statistics cover several different problems: fabricated identities, false qualifications, résumé lies, proxy interviews, and concealed interview assistance. These behaviors can distort hiring decisions and give fraudulent workers access to company systems.
This article examines how many job candidates are fake using applicant datasets, candidate surveys, employer reports, and enforcement cases. Each statistic identifies what was measured so readers can distinguish confirmed fraud from suspected activity, ordinary inaccuracies, and forecasts.
Author
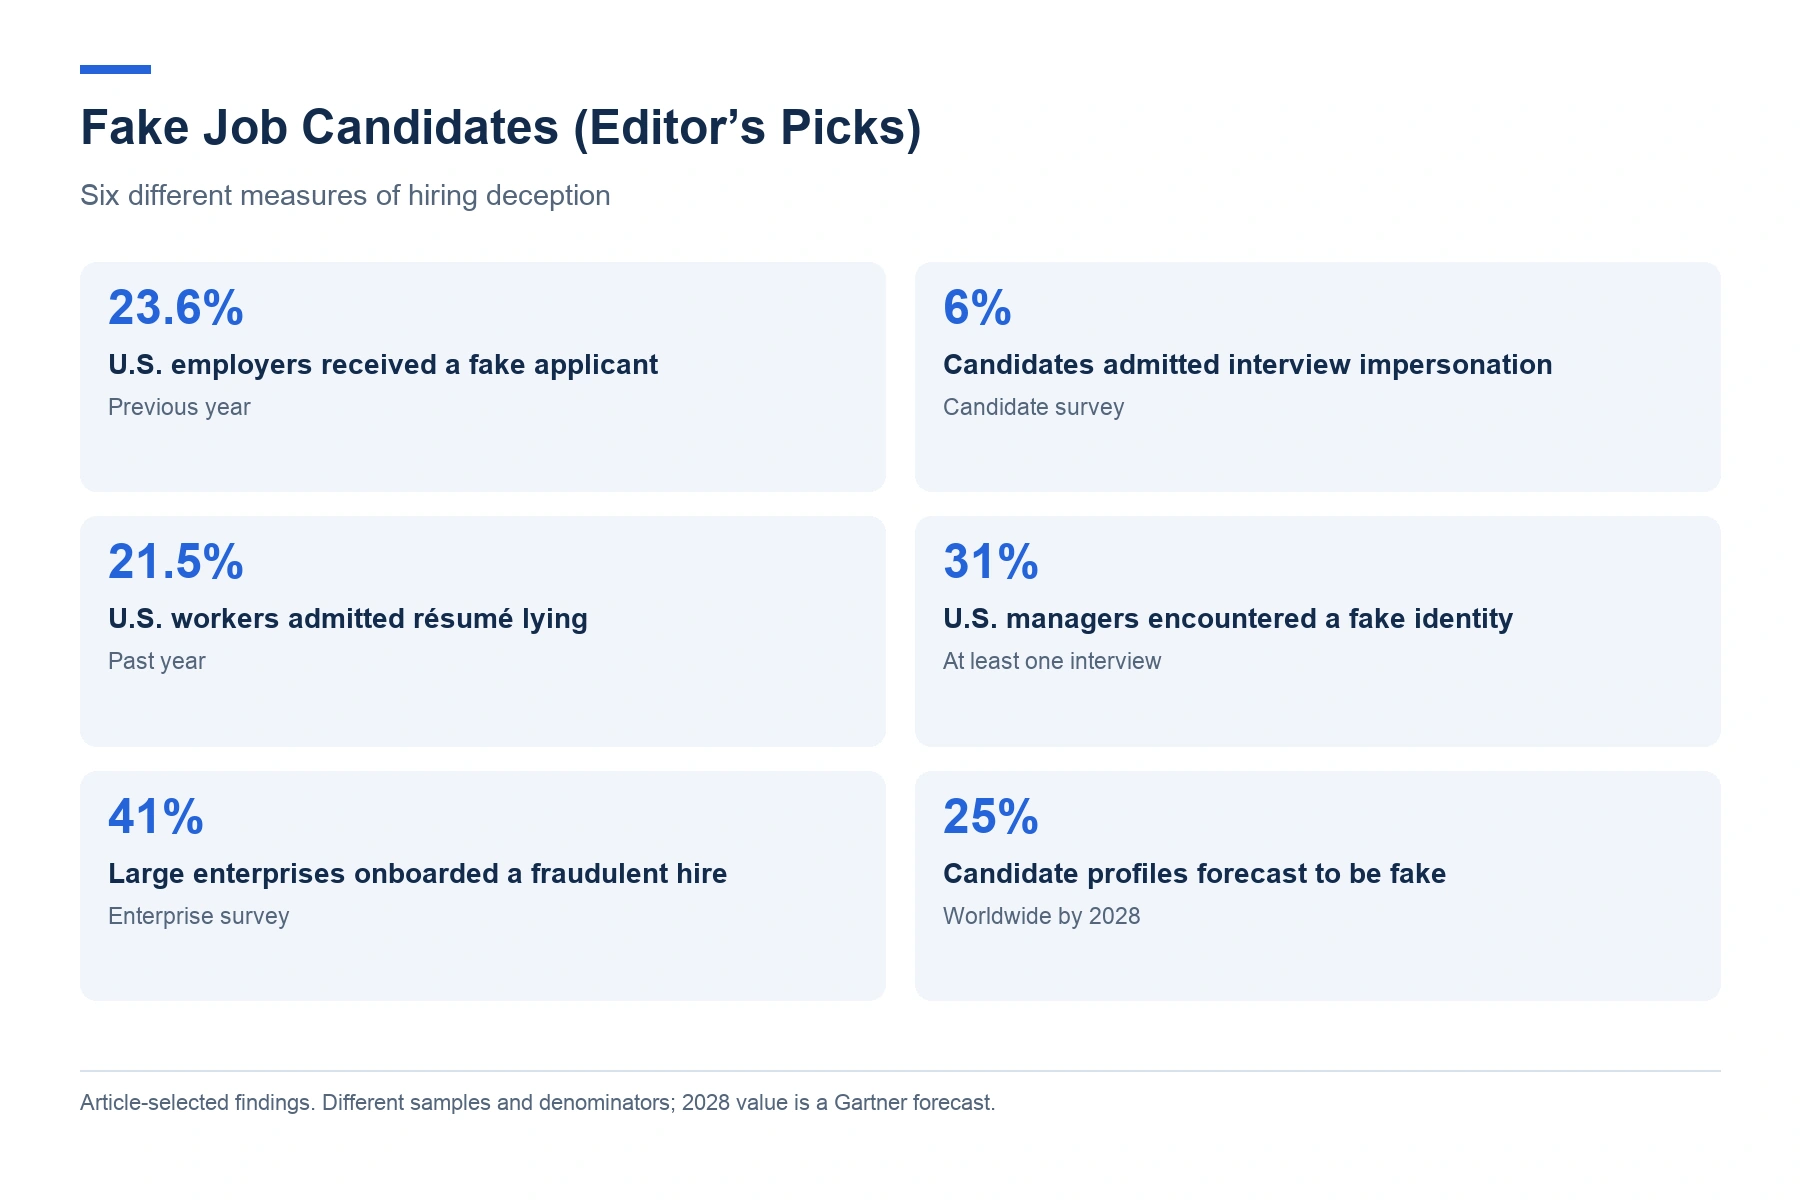

No reliable national or global percentage establishes how many job candidates are fake. The closest applicant-level evidence comes from individual employers and assessment platforms, whose results cannot represent the entire labor market.
Huntress flagged 23.2% of applicants as possible fraud risks between September and November 2025. This measured screening concerns at one cybersecurity employer, rather than confirmed fraud across all applicants.
Glider AI reported fraud indicators in 20%–25% of assessments in environments relying on unverified signals. Rates fell to 2%–4% after more mature verification controls were introduced.
Employer surveys answer a different question: how many hiring professionals encountered at least one suspicious or fraudulent candidate.
Research source | Reported result | Population or measure |
Hackett, 2026 | 67% | Talent-acquisition practitioners encountering suspected fraud in the previous 12 months |
First Advantage, 2026 | 76% | Hiring professionals encountering falsified employment information |
First Advantage, 2026 | 45% | Hiring professionals encountering identity misrepresentation |
Checkr, 2025 | 60% | U.S. managers confirming qualification or experience misrepresentation |
Checkr, 2025 | 13% | U.S. managers suspecting qualification or experience misrepresentation |
First Advantage surveyed more than 2,100 hiring leaders and CHROs, alongside 3,200 recent candidates, across five regions. Checkr’s manager survey covered 3,000 U.S. respondents involved in hiring.
An employer can receive hundreds of legitimate applications and one fraudulent application while still counting as an employer that encountered fraud. Encounter rates therefore cannot substitute for applicant prevalence.

There is no comparable annual series measuring all fake job candidates. Crosschq’s employment-verification discrepancy series provides a narrower trend, with rates increasing each year between 2021 and 2024.
Year | Result | What the research measured |
2020 | 78% | Checkster respondents who had misrepresented themselves or would consider doing so |
2021 | 9.9% | Crosschq employment-verification discrepancies |
2022 | 11.3% | Crosschq employment-verification discrepancies |
2023 | 12.8% | Crosschq employment-verification discrepancies |
2024 | 14.26% | Crosschq employment-verification discrepancies |
The 2020 result combines actual behavior with willingness to misrepresent information. It cannot be compared directly with verification discrepancies in later years.
Crosschq’s discrepancy rate increased by 44.0% from 2021 to 2024, equivalent to 4.36 percentage points. Annual relative growth moderated from approximately 14.1% in 2022 to 13.3% in 2023 and 11.4% in 2024.
These calculations describe changes within the same reported discrepancy series. They do not establish an equivalent increase in confirmed identity fraud.
A separate Crosschq analysis of nearly 200,000 reference-checking data points reported that intentional candidate misrepresentation increased almost fourfold relative to its 2021 baseline during the period studied through May 2023.
Fraud exceeded 7% in some high-volume hiring sectors. Reference-checking fraud and employment-verification discrepancies remain separate measures.
Glider AI previously estimated that approximately 10% of prospective hires attempted some form of fraud in its observed environment and reported that candidate fraud had nearly doubled after the pandemic began.
The timing overlaps with expanded remote hiring, but the research does not isolate remote work as the cause. Differences in screening, applicant volume, and detection can also influence reported rates.

Reported résumé-lying rates vary substantially with survey wording and the period covered. A lifetime admission, a recent fabrication, and an inaccurate statement on a submitted résumé measure different behaviors.
Survey | Admission rate | Definition |
Novorésumé, 2026 | 37.3% | Ever included inaccurate résumé information |
Resume Builder, 2025 | 24% | Ever lied on a résumé |
ResumeTemplates, October 2024 | 3% | Intentionally submitted a fraudulent résumé during 2024 |
ResumeTemplates, May 2024 | 22% | Fabricated résumé information during a search in the previous two years |
ResumeTemplates, December 2023 | 7% | Lied on a résumé during 2023 |
Novorésumé surveyed 2,000 U.S. adults aged 18–64. ResumeTemplates’ stricter October 2024 study screened 9,133 applicants, while Resume Builder’s January 2025 survey covered 2,000 U.S. adults who had applied for work.
Novorésumé’s 2026 findings provide a consistent comparison across several types of résumé inaccuracy.
Type of misrepresentation | Share reporting it |
Adjusted employment dates to conceal or shorten a gap | 18.9% |
Inflated years of experience | 14.3% |
Exaggerated job title | 12.6% |
Listed a skill they could not perform without substantial help | 10.7% |
Claimed an unearned degree, certification, or credential | 6.8% |
Falsified achievements or projects | 6.6% |
Listed a nonexistent or substantially fabricated job | 6.1% |
Among admitted résumé liars in Resume Builder’s survey, 38% misrepresented experience, 34% misrepresented skills, and 32% misrepresented position length. Those subgroup percentages should not be presented as rates among all candidates.
Resume.io’s 2026 survey found the following past-year admission rates:
Generation | Admitted résumé lying |
Gen Z | 37.1% |
Millennials | 29.3% |
Gen X | 14.3% |
Baby Boomers | 3.7% |
The supplied research does not establish comparable résumé-fraud rates for entry-level, managerial, senior, and executive candidates. Income and education findings should not be relabeled as seniority statistics.

No representative study in the supplied research measures fake identities as a share of all applicants. Available evidence primarily concerns employer encounters and documented criminal schemes.
RefAssured’s 2026 study found that 4% of corporate HR and hiring managers and 13% of staffing recruiters had personally encountered outright identity fraud.
These results differ from broader identity-misrepresentation measures because they use a narrower description of the behavior and different respondent groups.
The DOJ’s Christina Chapman case documented 68 stolen U.S. identities used in a remote IT employment scheme affecting 309 U.S. businesses and two international businesses.
A separate 2026 sentencing case involved at least 80 stolen U.S. identities and remote jobs at more than 100 U.S. companies. These are counts within individual schemes, rather than prevalence estimates.
The supplied research contains no representative applicant percentage for fully synthetic identities. Studies often combine stolen, borrowed, altered, and fabricated identities, preventing a clean synthetic-identity estimate.
Checkr found that 51% of U.S. managers agreed AI made it harder to trust what they saw and heard during virtual interviews.
DOJ cases document combinations of stolen identity documents, false résumés, remote computer access, and U.S.-based laptop farms. These methods allowed overseas workers to appear to be domestic applicants.
Sources: RefAssured, DOJ, DOJ, Checkr

Gartner’s direct candidate survey measures admitted impersonation; employer surveys measure encounters.Neither provides a verified percentage of all interviews containing an impostor.
Checkr found 35% of U.S. managers had confirmed that someone other than the listed applicant participated in a virtual interview.
That result means a manager encountered at least one substitution. It does not mean that 35% of virtual interviews involved proxy candidates.
Resume Genius found 17% of hiring managers encountered deepfake technology during interviews in 2025, compared with 3% in 2024.
Among Millennial hiring managers, the encounter rate reached 24%. The overall survey covered 1,000 U.S. hiring managers.
HYPR reported that 42% of hiring-fraud cases were detected only after employment began. Among cases that escaped initial screening, 45% took four to six days to surface, while 20% remained undetected for as long as three weeks.
Human observation or intuition uncovered 68% of fraudulent hires that bypassed initial screening. HYPR’s findings cover multiple fraud types and do not isolate post-hire candidate substitution.

There is no reliable percentage showing how many confirmed fake candidates use AI. Research instead measures AI adoption, fabricated application content, and suspected interview cheating.
Novorésumé found 42.6% used AI the last time they updated a résumé, while 7.5% let AI write most or all of it.
Within that AI-heavy group, 74.8% admitted résumé lying, compared with 24.6% of nonusers. Separately, 2.9%reported using AI to generate fake experience, accomplishments, or credentials.
These associations do not establish that AI caused the dishonesty.
Gartner found 39% of 3,290 candidates used AI during the application process in late 2024. Checkr’s July 2025 survey found 61% of 3,000 jobseekers used AI in their search.
Different samples and questions prevent interpreting those figures as a comparable growth series.
Novorésumé’s 2026 measure | Rate |
AI involved in the latest cover letter | 46.8% |
AI wrote some or all of the text | 30.3% |
AI wrote most or all of the latest letter | 11.8% |
Ever submitted an almost entirely AI-written letter with little editing | 32.4% |
These are overlapping categories, so their percentages should not be added.
Fabric reported AI-cheating flags in 38.5% of 19,368 AI-powered interviews conducted between July 2025 and January 2026.
Dedicated cheating assistants accounted for 45% of detected cases, voice-mode language models for 34%, and tab switching or second screens for 18%.
Fabric’s flag rate rose from 9% in July 2025 to 45% in September 2025. This is a platform-specific detection trend, not a measured increase across all hiring.
Using AI to edit truthful application materials does not establish a fake identity or fabricated qualification.

Country figures measure different behaviors and cannot support a ranking of fake-candidate prevalence. Some count employer encounters, while others count candidate admissions or screening discrepancies.
Country | Reported statistic | Definition |
United Kingdom | 18% | People who lied on a CV or application, or knew someone who did, in the previous year |
Canada | 22% | Jobseekers admitting they listed skills they lacked |
Australia | 42.5% | Respondents admitting lifetime application or interview dishonesty |
India | Approximately 10% | Candidates with background discrepancies in an EY screening analysis |
iHire’s 2026 survey covered 318 employers across 57 industries. Beyond reported encounters, 19.2% named fake applicants among their leading online-recruiting challenges.
The Cifas result combines personal conduct with knowledge of someone else’s conduct. It therefore cannot be read as the percentage of British applicants who personally lied.
The Express Employment Professionals–Harris Poll covered 502 jobseekers and 504 hiring decision-makers. 82% of managers said résumé claims failed to match real-world skills at least sometimes.
The StandOut Resume survey included more than 1,000 respondents. 20% reported lying multiple times, and three-quarters of those who lied said they were not caught.
EY analyzed more than one million screenings across over 90 mid-to-large organizations. Discrepancies can include errors, omissions, dual employment, or fraud; they do not automatically establish deliberate deception.

The clearest industry comparison concerns interview-cheating flags, rather than confirmed fake candidates.Credential-screening studies provide additional detail within groups already identified as discrepant.
Fabric’s technical interview flag rate reached 48%, compared with 12% for sales roles. These rates describe detected AI-cheating indicators in the analyzed interviews.
In EY’s Indian screening research, 84% of employment-discrepancy cases in financial services involved overstated experience or candidate misinformation.
Half of education-discrepancy cases in the sector involved fake certificates. Neither figure describes all financial-services applicants.
EY found fake employment documents among 75% of red-flagged healthcare candidates. 84% of healthcare education discrepancies involved credentials from institutions classified as unaccredited, unapproved, or fake.
Fake documents accounted for 88% of education-fraud cases in EY’s professional-services findings. The denominator is identified education-fraud cases, rather than the sector’s total applicant pool.
Among discrepant BPO, KPO, and global capability center profiles, 38% lacked mandatory documents, such as experience letters, service letters, or relevant employment-record consent.
Missing documentation can trigger further checks without establishing a fabricated candidate.
Sources: Fabric, EY, Times Ascent

The supplied research does not establish absolute fake-candidate rates by standardized seniority level. Available findings concern interview-cheating comparisons and the composition of identified offender groups.
Candidates with zero to five years of experience were nearly twice as likely as senior candidates to trigger AI-assisted interview-cheating flags in the cited analysis.
That experience band extends beyond first-time applicants and should not be treated as exclusively entry-level.
Experienced professionals represented the following shares of identified offenders in EY’s Indian screening findings:
Sector | Experienced professionals’ share of offenders |
IT and IT-enabled services | 79% |
Financial services | 88% |
Healthcare | 96% |
The findings do not separate mid-level workers from senior workers.
The interview analysis reports lower AI-cheating flags among senior candidates than among less-experienced candidates. It does not establish lower rates of credential fraud, identity deception, or fabricated employment history.
The supplied research contains no transparent, large-sample estimate of confirmed fraud among all executive applicants. Occupational-fraud losses after employment cannot substitute for executive-candidate prevalence.
Sources: Sherlock, Times Ascent

There is no defensible current global percentage of fake degrees in the supplied research. Available figures cover employer discoveries, document anomalies, and specific enforcement cases.
CheckFile reported anomalies in 6.1% of more than 65,000 U.S. HR academic documents analyzed by March 2026.
Anomalies included alterations, date inconsistencies, nonexistent institutions, and unaccredited issuers. The vendor’s anomaly rate is broader than confirmed forgery.
Hedd identified more than 300 bogus education providers in the UK. An international estimate of approximately 2,150 diploma mills dates to 2018 and should not be presented as a 2026 total.
A credential can be genuinely issued by an unauthorized institution while still failing to establish the claimed qualification.
Operation Nightingale documented more than 7,600 fake nursing diplomas and transcripts. Purchasers could use the documents to seek licensing examinations and healthcare employment.
The DOJ’s September 2025 Phase II action described approximately 7,300 fake nursing diplomas. Related enforcement totals should not be added without checking for overlapping cases.
UK employers reported the following coverage for verifying every academic credential:
Employer size | Verified every academic credential |
Large | 52% |
Medium | 37% |
Small | 29% |
These percentages measure verification coverage. They do not measure how many credentials failed.

Documented fraudulent hiring schemes have generated millions of dollars and exposed company systems to unauthorized workers. Enforcement records provide confirmed case evidence, although they cannot establish national applicant rates.
GetReal surveyed 668 IT, cybersecurity, risk, and fraud leaders at organizations with at least 1,000 employees, across 15 industries.
Only 35% identified fake candidates as a primary concern. The sample represents large enterprises rather than employers of every size.
DOJ case or action | Documented financial or infrastructure scale |
Remote-worker scheme sentenced in 2026 | More than $5 million in illicit revenue; at least $3 million in employer damages |
Christina Chapman scheme | More than $17 million generated; over 90 laptops seized |
Indictment of 14 North Korean nationals | At least $88 million generated over approximately six years |
Coordinated 2025 action | 29 suspected or known laptop farms across 16 states; approximately 137 laptops seized |
These figures concern separate enforcement records and should not be combined into one unduplicated loss total.
The indictment involving 14 North Korean nationals described cases in which workers stole proprietary source code and threatened disclosure unless employers paid extortion.
Fraudulent hiring can therefore create exposure beyond salary payments, including intellectual-property theft and unauthorized access.
The DOJ describes overseas IT workers using false, stolen, or borrowed identities to obtain remote employment. U.S.-based laptop farms helped conceal their locations and enabled access to employer devices.

Hackajob’s Archer dataset provides channel-specific identity-risk flags, rather than confirmed fraud rates. It covered more than 70,000 U.S. candidates open to remote work in July 2026.
Candidate source | Medium or suspicious risk flag |
Job boards and aggregators | 67% |
Direct or origin unknown | 51% |
Professional network | 45% |
Paid social | 43% |
Organic search | 43% |
Paid search | 38% |
Flagged candidates required additional identity verification because their digital signals did not align.
Breezy analyzed 3.2 million U.S. and European applications and reported approximately one bot application in every 14 applications.
Spam exceeded 40% for some roles, but the supplied summary does not establish a separate fraud rate for each job board.
The Archer category “professional network” does not identify LinkedIn separately. Its rate cannot be presented as the percentage of LinkedIn applicants who are fake.
RefAssured found 95% of staffing recruiters had personally caught qualification, experience, or identity misrepresentation. This measures recruiter exposure rather than fraudulent agency submissions.
The research does not provide a reliable confirmed-fraud percentage for employee referrals. Higher hiring conversion does not establish lower fraud.
The Archer category “direct or origin unknown” includes uncertain origins and is not a clean career-site category. No standalone confirmed-fraud rate for employer career sites appears in the supplied research.
Sources: Hackajob, Breezy, RefAssured

Forecasts anticipate continued demand for candidate verification, but market projections do not measure future fraud prevalence. The strongest forward indicators concern screening spending and planned adoption.
Experian’s 2026 forecast identifies deepfakes targeting HR as an emerging threat. Its accessible release does not provide a numerical forecast for hiring-fraud growth.
Gartner’s forecast concerns candidate profiles worldwide, rather than verified hires or confirmed synthetic identities.
Pindrop reported a 1,300% increase in deepfake fraud attempts across its monitored systems in 2024.
That figure covers broader enterprise voice and contact-center fraud. It should not be described as a 1,300% increase in fraudulent job interviews.
Market research publisher | Reported starting value | Forecast |
TBRC / Research and Markets | $5.41 billion in 2026 | $7.75 billion by 2030 |
Fortune Business Insights | $7.78 billion in 2026 | $13.71 billion by 2034 |
IMARC | $6.55 billion in 2025 | $11.57 billion by 2034 |
Different market definitions explain why the estimates vary. These totals cover employment-screening services more broadly than fake-candidate detection alone.
First Advantage found 89% of HR hiring managers planned to add screening and identity-verification solutions within two years.
An iProspectCheck survey reported that 80.9% of U.S. managers and owners believed identity verification should be standard in background screening. However, 5.1% reported no formal pre-hire identity verification, and 22.3% were unsure what their process included.
Only 39% verified previous employment for every hire, while 35.2% always verified education. Planned adoption therefore exceeds consistent verification coverage in the cited research.
Citable fake-candidate statistics require a clear denominator and definition. Applicant flags, employer encounters, admitted lies, confirmed criminal cases, and forecasts each describe a different part of hiring fraud. Keeping those measures separate produces a more accurate account than assigning one percentage to all candidates.
You are currently viewing a placeholder content from Calendly. To access the actual content, click the button below. Please note that doing so will share data with third-party providers.
More InformationYou are currently viewing a placeholder content from Calendly. To access the actual content, click the button below. Please note that doing so will share data with third-party providers.
More InformationYou need to load content from reCAPTCHA to submit the form. Please note that doing so will share data with third-party providers.
More InformationYou are currently viewing a placeholder content from Turnstile. To access the actual content, click the button below. Please note that doing so will share data with third-party providers.
More InformationYou are currently viewing a placeholder content from Vimeo. To access the actual content, click the button below. Please note that doing so will share data with third-party providers.
More InformationYou need to load content from reCAPTCHA to submit the form. Please note that doing so will share data with third-party providers.
More InformationYou are currently viewing a placeholder content from Elfsight. To access the actual content, click the button below. Please note that doing so will share data with third-party providers.
More InformationYou are currently viewing a placeholder content from reCAPTCHA. To access the actual content, click the button below. Please note that doing so will share data with third-party providers.
More Information