Hiring managers interview an average of 20 candidates per hire in 2026, up sharply from 14 back in 2021. That number swings hard by role too. Technical hires often mean 17.6 interviews, while business roles sit lower at 11.7. Company size widens the gap even more, with enterprises running up to 75 interviews per hire against just 9 to 11 at small businesses. Here’s a full breakdown of what’s driving these numbers.

Author
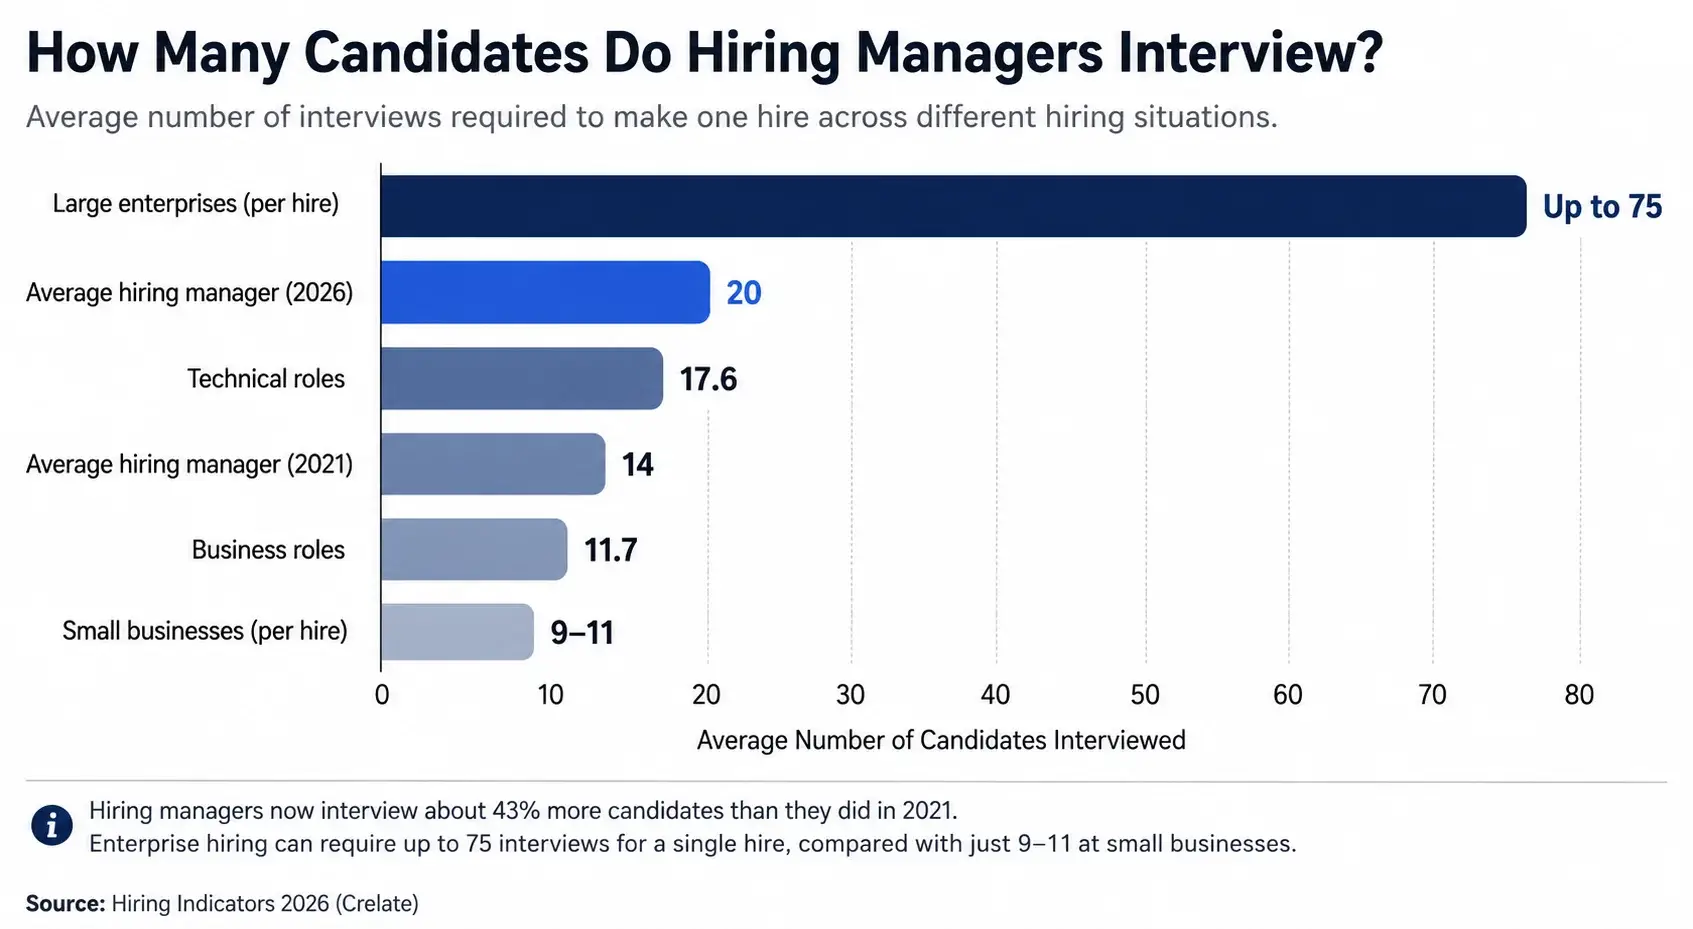
Hiring managers interview an average of 20 candidates per hire in 2026, up sharply from 14 back in 2021. That number swings hard by role too. Technical hires often mean 17.6 interviews, while business roles sit lower at 11.7. Company size widens the gap even more, with enterprises running up to 75 interviews per hire against just 9 to 11 at small businesses. Here’s a full breakdown of what’s driving these numbers.
Author

Hiring is picking back up, but the process behind it looks nothing like it did a few years ago. AI now sits at the center of nearly every stage.
Recruiters used to review every application by hand. That’s no longer the norm. Most companies now lean on AI at some point in the hiring chain, and it shows in the speed of the process. Screening that once took days now wraps up in under 24 hours for many teams. Some firms even push through 10 to 20 times more candidates in that same window.
Conversational AI screening takes this further. Hiring teams invite around 70 candidates per job to a first-round chat, and most finish it within four days. No human panel could pull that off.
Voice-AI screening for entry-level roles brought in stronger outcomes too. Offers rose by 12%, job starts climbed 18%, and 30-day retention improved by about 17%. Humans still make the final call, but AI now handles the heavy lifting upfront.
Recruiter teams have shrunk by 14% while application volume has jumped 93%. That gap won’t close on its own, so AI-led screening will likely carry even more weight heading into 2027.
Demand isn’t slowing down either. Business and financial roles alone are set to open up close to a million spots a year through 2034.
Healthcare stands out here. It’s projected to add more jobs than any other sector, which means interview volume in clinical hiring will only keep building.
Sources: Gem, Ashbyhq, Interviewflowai, Wecreateproblems, Employerbranding, Getraffi, Jobintel
Getting hired today means clearing more hoops than ever. The numbers at each stage of the funnel show just how much tighter things have become.
Ask five sources how many people apply to a single job and you’ll get five different answers. Estimates swing from 31 to 340 applicants per opening, depending on company size, role level, and whether the job allows remote work. One thing is consistent though. Applications per posting have roughly doubled since 2021, moving from 46 up to 95.
Only 8 out of every 100 applicants make it past the first screen. That number holds steady across most benchmarks, though it shifts a bit by industry.
Recruiters also take their time here. Screening a candidate before moving them forward takes about 6 days on average.
Once a candidate clears the screen, about 37% go on to a formal interview. That rate changes depending on the type of role.
This is where the funnel has tightened the most. Interview-to-offer conversion has more than doubled since 2015, jumping from 17% to 36.2%. Company size plays a big role in how that plays out.
Good news for employers here. 82% of candidates accept their offers in 2026, the highest rate since 2021. Technical roles still lag behind though.

No two industries hire the same way. Applicant volume, offer rates, and time-to-fill all shift depending on the field.
Tech pulls in more applicants than any other industry, somewhere between 191 and 369 per job. That flood of interest doesn’t translate into offers though. Tech holds the lowest offer rate of any sector at just 0.66%, compared to healthcare’s 2%.
Technical roles also demand the most interview time. Hiring teams run through 17.6 interviews per hire on average, totaling 23.3 hours, roughly double what business roles require. Acceptance rates sit a bit below average too, landing around 77 to 80.8%.
Healthcare flips the script. It gets the fewest applicants of nearly any industry, as low as 33 to 47 per hire, yet lands the highest offer rate at 2%.
Filling those roles still takes a while though. Positions sit open for 49 days on average, nearly 40% longer than the typical 36-day benchmark. Credentialing requirements slow things down.
Career fairs tell a brighter story. In-person events convert 85% of interviews into offers, and virtual ones hit 78%. Turnover remains a real cost too. RN turnover sits at 17.6% nationally, and that costs hospitals over $5 million a year on average.
Finance sees a healthy volume of applicants, somewhere between 61 and 120 per opening. But the path from application to interview narrows fast, sometimes dropping as low as 1.3 to 3%, especially for early-career buy-side roles.
The hiring timeline runs long here too. It now takes 40 to 45 days on average to move from posting to offer, and most firms report that timeline stretching further each year. Demand for finance and accounting talent has surged 150% year over year, yet only 6% of organizations say they have enough qualified people to fill priority roles.
Manufacturing takes a different approach entirely. It draws 45 to 49% fewer applications than the industry average, landing somewhere around 100 to 180 per hire. What it lacks in volume, it makes up for in commitment. Manufacturing holds the highest offer-acceptance rate of any industry, above 90%.
Employment in the sector has stayed fairly flat through mid-2026, and unemployment sits at a low 2.9%.
Hospitality pulls in 60% more applications than the average industry, around 117 per hire. But that volume doesn’t carry through the funnel. Interview and offer rates both run well below average, roughly 55% and 50% lower.
Only about 1 in 5 interviews in this space actually turns into a hire. Time-to-fill runs 18 to 39 days depending on the role. The sector has also taken a hit lately. Leisure and hospitality shed 61,000 jobs in a recent month, and nearly 38% of offer letters went unanswered before they expired.
Sources: Hrpanda, Employinc, Smartrecruiters, Jobintel, Job-analysis, Talentmsh, Healthxevents, Reveliolabs
Company size shapes the hiring process more than almost any other factor. Interview counts, acceptance rates, and applicant volume all shift depending on whether you’re dealing with a five-person startup or a global enterprise.
Startups run about 15 interviews per hire on average, though that splits out to 18 for technical roles and 13 for business roles. Candidates spend roughly 2.5 to 3 hours interviewing total, which lines up with the broader industry norm.
Bigger startups also put in more hours per hire. Teams at the 100 to 300 employee range log around 29 interviewer-hours per technical hire, compared to 21 hours at smaller shops. Offer acceptance holds steady around 80% across the board. Applications have surged too, with the average startup role now pulling in about 340 applicants, up 182% since 2021.
Small and mid-size businesses keep interviews lean, running just 9 to 11 per hire. But don’t let that fool you into thinking the funnel is easy. A quarter of applicants make it to pre-onsite stages, yet only 0.3% actually land the job once filtering kicks in.
Mid-market companies hit a sweet spot that other sizes struggle to match. Interview-to-offer conversion lands at 16.6%, and offer acceptance tops out at 89.8%, the highest of any company size tracked.
Enterprises run the most interviews of any company size, landing between 65 and 75 per hire. That’s roughly seven times what a small business runs, driven by heavier applicant volume and more layers in the hiring process.
Fewer than 10% of enterprise applicants reach the pre-onsite stage, but the ones who do convert well. That produces a full-funnel hire rate of 0.7%, more than double what smaller companies see. Enterprises also move fast at the screening stage, averaging just 5.7 days, even with all that scale working against them. Offer acceptance comes in at 81.5%.
Sources: Ashbyhq, Yomly, Sci-Tech-Today, Recruitbpm, Employinc, Gem, Jobscore

Seniority changes everything about how long a hire takes and how many hoops a candidate has to jump through. The higher the role, the longer and more demanding the process gets.
Entry-level roles move fastest through the pipeline, averaging just 46 days to fill. They also pull in the most applications of any tier, somewhere between 300 and 500 per role, roughly two to three times what senior roles see.
Acceptance rates tend to run higher here too, though the numbers vary a lot by source. One dataset puts entry-level acceptance at 42% against 28% for senior roles, while broader benchmarks put general acceptance closer to 75-82%. Despite the fast timeline, entry-level postings have actually been shrinking, down 7.5% year over year as of May 2026.
Mid-level roles typically call for two to four years of experience and take about 60 days to fill, roughly 30% longer than entry-level. Application volume drops off here too, landing between 150 and 250 per role, about half of what entry-level postings pull in.
Demand has softened at this level as well. Mid-level postings fell 6.7% year over year as of May 2026, even as hiring for senior roles kept climbing.
Senior roles take considerably longer to fill, running 75 to 90 days depending on whether it’s a manager or director-level position. Nearly 40% of senior roles blow past the 90-day mark entirely, and technical senior roles can stretch even further.
Demand for senior talent is clearly rising though. Senior postings jumped 14.7% year over year as of May 2026. Software development shows this shift the most starkly, where over two-thirds of postings now sit at the senior level.
Fewer applicants apply per senior posting compared to entry-level, which reflects a smaller pool of people who actually qualify.
Executive hiring has slowed down considerably. Timelines stretched to about 126 days in 2025, up 50% from 2022, and VP+ roles at large enterprises can drag past six months when multiple hiring committees get involved.
Competition has intensified too. The average director-level candidate now applies to 18 to 24 roles during a serious search, up from just 8 to 12 a few years back. Cost climbs sharply at this level as well, averaging $35,879 per hire, about seven times the non-executive average. Referrals still win out over job boards, driving 36% of actual placements compared to just 7% from job boards.
Sources: Theresource, Matchr, Nu, Hiringlab, Careerhelp, Worldmetrics, Tryjobhunter, Closecohen, Pin, Interviewcost, Onehour
Not every hiring scenario plays by the same rules. Remote versus onsite, high demand versus low demand, and internal versus external hiring all come with their own patterns worth knowing.
Remote postings pull in far more applications, often landing between 400 and 1,000+ per role compared to 100 to 200 for onsite jobs. But that flood of interest doesn’t translate into interviews at the same rate.
Nearly half of job seekers say they prefer fully remote work, which drives up competition and pushes the per-applicant interview rate down. Remote roles also tend to take a bit longer to fill, averaging 32.4 days globally against 27.2 days for onsite positions.
Companies are leaning more on their own people these days. Internal mobility’s share of all hires climbed from 51% in 2021 to 62% in 2025. Still, most organizations haven’t fully embraced this shift. Only 22 to 25% fill more than 30 to 50% of roles internally.
There’s a real cost to going outside too. Wharton research found external hires get paid about 18% more, yet take two to three years to match the performance of someone promoted from within. Even so, external hiring keeps growing. External applications and hires both rose 5-6% year over year, while internal hires actually dipped slightly despite more people applying internally.
Contract hiring is picking up steam in some markets, even as permanent placements slow down. UK data from June 2026 shows contract billings growing at their fastest pace in over three years.
Contract roles also close faster relative to how many get opened. Small agencies see fill rates of 111% for contract work against just 37% for permanent roles. That said, permanent placements still bring in more revenue per hire, at roughly $14.9k each. Only about 5% of European employers currently run both hiring tracks side by side, so the dual approach remains more of an exception than the rule.

Interview rounds keep stacking up year after year, and the gap between what employers want and what candidates can tolerate keeps widening. Let’s break down where the process actually stands.
The median hire today goes through 5 separate interview stages before a decision gets made. That’s not an isolated trend either. 42% of employers now push candidates through 5 or more rounds, and half of all hiring processes stretch past four weeks.
Candidates aren’t thrilled about this shift. 65% of UK candidates say they’d rather see just 1 to 2 rounds, and 52% flat out call 4 to 5 rounds excessive. Employers keep adding steps while candidates keep asking for fewer.
Waiting around is a real problem in hiring right now. About a third of candidates expect scheduling to happen within 2 to 3 weeks, but that patience runs thin fast.
The good news is that initial screening has sped up a bit, dropping to 7.2 days from 8.3 in just two years. Once the first interview wraps up though, the rest of the process still drags on for about 5 weeks on average. Ghosting remains a major pain point too. 83% of candidates want a quick answer either way, yet 61% report getting ghosted entirely after an interview, a number that keeps climbing year over year.
Time-to-fill has grown considerably worse over the past five years. The national average now sits at 44 days, up a third from 33 days back in 2021. Some sources put the figure even higher, closer to 63 to 68 days depending on methodology.
Referrals cut through this delay in a big way. Referral hires close 55% faster than candidates sourced through typical channels, landing roughly 29 days ahead of the average timeline. AI offers an even sharper shortcut. Deploying it at the top of the funnel can shrink time-to-hire from 44 days down to just 11, a drop of 75%.
Hiring costs money at every level, and that number keeps rising. Non-executive cost-per-hire now averages $5,475, up from around $4,700 just a few years back.
Sales loops run $4,000 to $10,000 and typically involve 10 to 16 interviewer hours. Executive loops demand far more, often 20 to 30+ hours plus outside search fees stretched over 60 to 120 days. Teams that lean on AI for screening and scheduling report cutting cost-per-hire by 20 to 40%. Even candidates feel the pinch. A single interview can cost someone around $70 in personal expenses.
Sources: Pin, Instantinterview, Yomly, Nu, Standout-cv, Jobintel, Provenbase, Talentmsh, Theresource, Nextinhr, Interviewcost
Getting through the door has never been harder, and the data behind rejection shows exactly why so many strong candidates never hear back.
The top of the funnel is brutally selective. Only 8% of applicants make it past initial screening, and just 0.5% ever receive an offer. That works out to roughly one hire for every 200 applications submitted.
For a typical posting that pulls in 250 applications, only 4 to 6 candidates actually get invited to interview, and just one walks away with the job.
Clearing the recruiter screen puts a candidate in decent shape. About 35% move on to a first formal interview, and 95% of those who reach the post-onsite stage make it through.
AI screening seems to sharpen results downstream too. Candidates who passed an AI-led screen went on to succeed in human interviews 53% of the time, well above the 29% success rate for those screened the traditional way.
Interview-to-offer conversion varies quite a bit depending on the source, ranging from 27% up to 47.5%. Once an offer actually lands though, acceptance runs high at 82%, the strongest rate since 2021. Overall, just over a quarter of interviewed candidates end up hired, landing a 27% interview-to-hire rate.
Most rejections come down to a handful of recurring issues. Not enough experience tops the list at 16.6%, followed closely by wrong role type and wrong industry background.
Once candidates make it to a live conversation, the reasoning flips entirely. 72.2% of rejections at that stage come down to simply “not interested” rather than any skills gap. Soft factors matter a lot here too. 71% of employers reject candidates over inappropriate dress, and 77% reject applications riddled with typos.
The interview stage causes more candidate drop-off than any other part of the funnel, accounting for 32% of all losses. That beats out application abandonment, scheduling delays, and onboarding friction combined.
Tech hiring shows this pattern most sharply. Around 60% of candidates opt out after four or more rounds, driven by slow timelines and silence after interviews. Even candidates who make it to the offer stage aren’t fully locked in. About 9% drop off after receiving an offer, and 40% report being ghosted specifically after a second or third round.

AI has moved from a nice-to-have to a core part of how companies filter and rank candidates. The numbers show just how far that shift has gone.
Adoption estimates swing depending on who you ask, but the direction is clear. 51% of organizations use AI to support recruiting, and that number climbs sharply among big players.
Among large corporations specifically, 82% use AI for resume screening, and nearly every Fortune 500 company runs an ATS with AI-assisted filtering built in. Broader worker surveys push the number even higher, with 87% of companies reporting some form of AI use in recruitment.
Voice and conversational AI tools let recruiters invite around 70 candidates per job to first-round interviews, a scale no human panel could pull off manually. Most of those invitees, 70 to 85%, complete the interview within four days.
AI screening at the top of the funnel can cut time-to-hire from 44 days down to just 11. Yet total interviews per hire have actually gone up, climbing from 14 in 2021 to 20 in 2026. AI widens the funnel at the top while selectivity tightens further down, so both trends grow at once. 73% of recruiters using AI say they can shortlist candidates within 24 hours, a pace manual review simply can’t match.
AI ranking tools perform well on objective tasks. Resume parsing scores highest at 94% accuracy, followed by experience analysis and skill matching.
Companies using AI-powered recruitment report real gains. Hiring times run 31% faster, and quality-of-hire metrics improve by roughly half.
AI even helps candidates who use it on their own resumes. Those candidates were 7.8% more likely to get hired and pulled in wages 8.4% higher on average. Still, full automation remains rare. Only about 1 in 5 organizations have reached true end-to-end AI hiring, meaning humans still make the final call in the vast majority of cases.
Sources: Marxel, Stealthagents, Employerbranding, Coversentry, Secondtalent, Osforyour, Careertrainer, Yena, Taleva, Sqmagazine, Azumo, Toolixlab
Hiring in 2026 looks nothing like it did five years ago. Interviews take longer, funnels run tighter, and AI now touches nearly every stage before a human steps in. Company size, seniority, and industry all shape how many rounds a candidate faces and how fast an offer follows. One thing stays constant though. The teams that adapt to these shifts, whether through AI screening, faster scheduling, or leaner processes, are the ones landing top talent before it slips away.
You are currently viewing a placeholder content from Calendly. To access the actual content, click the button below. Please note that doing so will share data with third-party providers.
More InformationYou are currently viewing a placeholder content from Calendly. To access the actual content, click the button below. Please note that doing so will share data with third-party providers.
More InformationYou need to load content from reCAPTCHA to submit the form. Please note that doing so will share data with third-party providers.
More InformationYou are currently viewing a placeholder content from Turnstile. To access the actual content, click the button below. Please note that doing so will share data with third-party providers.
More InformationYou are currently viewing a placeholder content from Vimeo. To access the actual content, click the button below. Please note that doing so will share data with third-party providers.
More InformationYou need to load content from reCAPTCHA to submit the form. Please note that doing so will share data with third-party providers.
More InformationYou are currently viewing a placeholder content from Elfsight. To access the actual content, click the button below. Please note that doing so will share data with third-party providers.
More InformationYou are currently viewing a placeholder content from reCAPTCHA. To access the actual content, click the button below. Please note that doing so will share data with third-party providers.
More Information