Average applications per hire measures how many applications employers process for each completed hire. It helps readers assess applicant competition and recruiting workload, but published benchmarks vary substantially by employer population and counting method.
This article covers annual trends, industries, occupations, company sizes, countries, work arrangements, hiring conversions, and application quality. Applications per job, applicants per posting, and candidate entries in an applicant tracking system are labeled separately because they do not measure the same outcome.

Author

Average applications per hire measures how many applications employers process for each completed hire. It helps readers assess applicant competition and recruiting workload, but published benchmarks vary substantially by employer population and counting method.
This article covers annual trends, industries, occupations, company sizes, countries, work arrangements, hiring conversions, and application quality. Applications per job, applicants per posting, and candidate entries in an applicant tracking system are labeled separately because they do not measure the same outcome.
Author
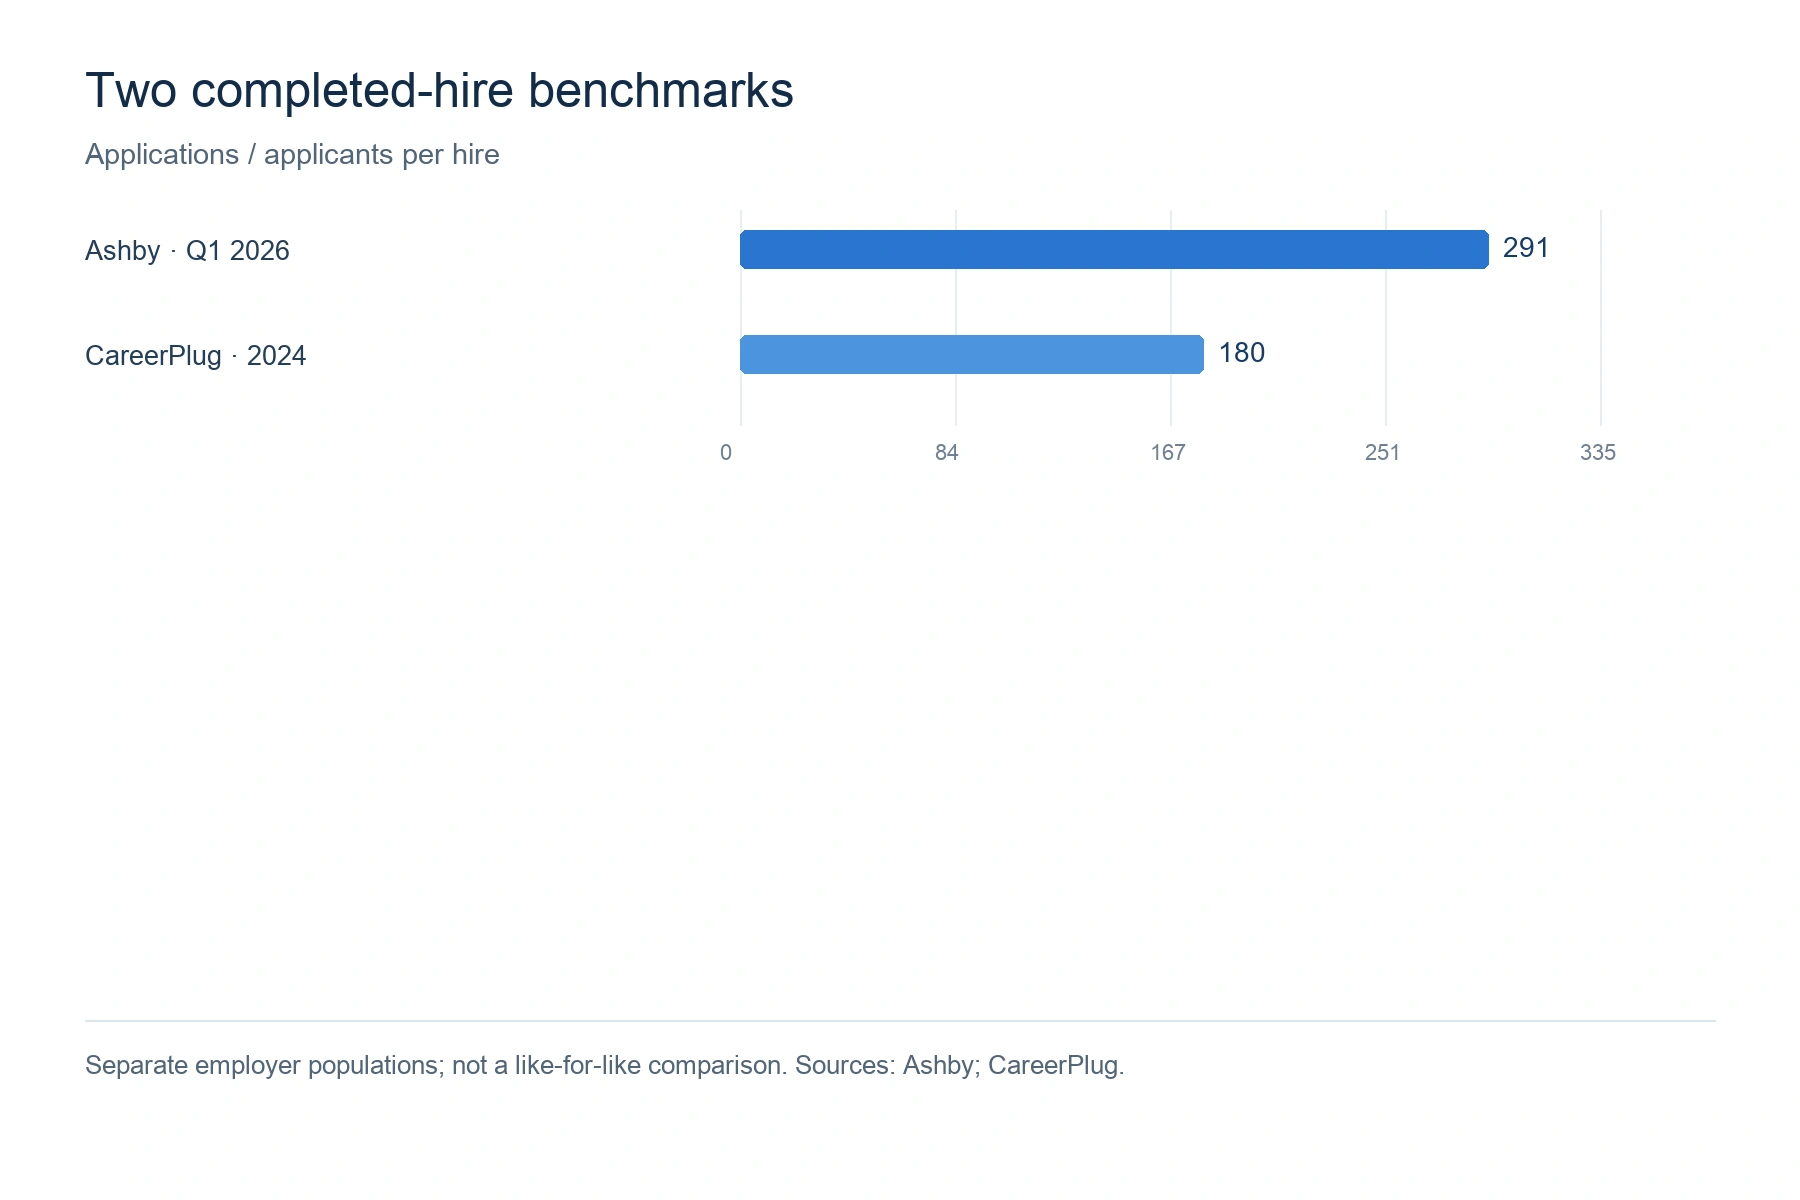

Ashby’s latest direct benchmark covers 109 million applications and 247,000 jobs from January 2021 through March 2026. Its quarterly average exceeded 300 applications per hire throughout 2025 before declining in Q1 2026.
No single dataset provides an exact, comparable annual applications-per-hire figure for every year. Greenhouse provides a fuller annual series, but its denominator is jobs rather than completed hires.
Period | Ashby applications per hire | Greenhouse applications per job |
Early 2021 | Approximately 100 | Not reported |
2022 | Exact annual figure unavailable | 116 |
2023 | Exact annual figure unavailable | 189 |
2024 | 319 in Q4; annual figure unavailable | 223 |
2025 | Above 300 in every quarter | 244 |
Q1 2026 | 291 | Not reported |
Greenhouse’s applications-per-job series shows slowing growth after a sharp increase in 2023.
Year | Applications per job | Annual increase | Calculated annual growth |
2022 | 116 | — | — |
2023 | 189 | 73 | 62.9% |
2024 | 223 | 34 | 18.0% |
2025 | 244 | 21 | 9.4% |
Employ separately recorded 24.3% growth, from 207.2 applications per job in 2024 to 257.6 in 2025. These changes describe posting volume, not annual applications per completed hire.
Ashby’s early-2021-to-Q1-2026 series indicates that applications per hire remained close to three times their initial level, despite easing from the Q4 2024 peak.
BambooHR also recorded rising posting-level volume: approximately 46 applicants per posting in 2021, compared with 95 in 2025. Its analysis covered more than 72 million applications and 1 million postings.
A directly comparable 2019 applications-per-hire baseline is unavailable in the research. The consistent Ashby series begins in early 2021, after the pandemic started.
Consequently, the five-year increase should be described as a post-pandemic trend. It does not establish the size of the change from pre-pandemic hiring conditions.

SmartRecruiters’ industry comparison uses September 2023–August 2024 data. Its scorecards label the measure “applicants per hire,” while its methodology describes applicants per role and notes that some jobs did not produce a hire. The figures therefore require that qualification.
Technology attracted 110 applicants per role in SmartRecruiters’ dataset, approximately 51% above its global benchmark of 73.
Employ reported substantially higher technology volume in its separate 2025 dataset. Differences in platform customers, reporting periods, and denominators prevent a direct comparison between the two figures.
Healthcare averaged 40 applicants per role, approximately 45% below SmartRecruiters’ global benchmark. About 5.3% of applicants reached interviews, and 2.0% received offers.
Healthcare was outside Employ’s five-industry study, so that report does not provide a matching comparison.
The research does not establish a reliable, large-sample applications-per-hire benchmark for financial services.
Finance-department conversion data appear later in the occupation section. Those figures concern a job function across employers, rather than the financial services industry.
SmartRecruiters recorded higher application volume in hospitality than retail.
Industry | SmartRecruiters applicants per role | Employ applications per job, 2025 |
Retail | 65 | Exact figure unavailable |
Hospitality | 117 | 202.9 |
Manufacturing | 38 | 176.4 |
Hospitality’s result also exceeded technology’s within SmartRecruiters’ sample. Industry rankings should therefore stay tied to their specific dataset.
Manufacturing’s SmartRecruiters benchmark was approximately 49% below the global average. Employ also placed manufacturing below technology and hospitality on applications per job.
Employ included business and professional services, but the research does not provide its exact application-volume figure.

The research does not establish a universal applications-per-hire average for entry-level roles. Available graduate recruitment evidence is specific to U.K. employers and appears in the high-competition section.
Entry-level corporate vacancies, apprenticeships, and local hourly jobs should not share a single benchmark without a comparable sample.
No direct, large-sample applications-per-hire benchmark isolates mid-level positions in the research.
Figures grouped by department or employer size include multiple seniority levels. They cannot establish how many applications a typical mid-level vacancy receives.
Approximately 35% of executive hires came from inbound applicants in the Ashby sourcing findings cited in the research, compared with roughly half of hires overall.
This is a hiring-channel share, not an applications-per-hire count. It indicates that inbound applications account for a smaller portion of executive hiring.
CareerPlug’s small-business dataset offers relevant context for hourly hiring. It covers more than 60,000 businesses and 10 million applications, although the overall result is not restricted to frontline roles.
Local, decentralized, and continuously open vacancies can produce different application and hire counts from corporate recruiting systems.
Ashby’s startup analysis covered more than 1,200 venture-backed companies, 11 million applications, and 32,000 hires.
Remote roles had a 9% higher offer-acceptance rate than in-office roles overall. The relative advantage was 13% for technical positions and 4% for business positions.

Employ recorded 312 applications per job at businesses with fewer than 250 employees, the highest published company-size result in its 2025 dataset.
Employ associates this volume partly with broader, more general roles. Its result should not be substituted for CareerPlug’s completed-hire benchmark.
Employ defines mid-market companies as those with 250–999 employees. An exact applications-per-job figure is unavailable in the research.
Its published interview-to-offer rate was 16.6%, providing a funnel comparison without establishing total applicant volume.
Employers with 1,000 or more employees averaged 208.1 applications per job.
Employ company segment | Employees | Applications per job |
Small business | 0–249 | 312 |
Mid-market | 250–999 | Not available |
Enterprise | 1,000+ | 208.1 |
BambooHR used different size categories. Employers with at least 151 workers received 46% of applications in 2025, compared with 41% in 2021. Employers with fewer than 25 workers saw their share fall from 21% to 15%.
Those percentages measure the distribution of applications across company sizes, not applications per vacancy.

SmartRecruiters provides a consistent country comparison covering the same reporting period. Its role-versus-hire methodology qualification also applies to these country figures.
Country | Applicants per role | Applicants interviewed | Applicants receiving offers |
United States | 74 | 4.3% | 1.5% |
United Kingdom | 72 | 4.3% | 1.1% |
Australia | 65 | 6.0% | 2.0% |
France | 93 | 2.2% | 0.6% |
Germany | 48 | 5.4% | 1.4% |
The U.S. result was close to SmartRecruiters’ global average. However, national figures conceal substantial differences between technical and business hiring.
Ashby’s broader Americas region recorded 610 inbound applications per technical hire, compared with 229 per business hire. These regional results are not U.S.-only estimates.
The U.K. had a similar interview rate to the United States but a lower applicant-to-offer rate in SmartRecruiters’ sample.
Its national benchmark also covers a broader mix of jobs than the graduate-employer figures discussed later.
A comparable national applications-per-hire figure is unavailable. Canada averaged approximately 498,700 vacancies in 2025, down from about 570,800 in 2024.
The research also reports nearly four unemployed people per vacancy by December 2025. This measures labor-market supply relative to vacancies, rather than submitted applications.
Australia’s applicant-to-interview and applicant-to-offer rates were the highest among the five countries listed.
Its lower application volume than France or the United States did not correspond to lower advancement rates.
France recorded the highest applicant volume among these countries, while Germany recorded the lowest.
Ashby’s EMEA benchmark separately reported 170 inbound applications per business hire and 254 per technical hire. Applications per hire in that region doubled between early 2021 and 2026.

Fully remote roles represented 8% of paid U.S. LinkedIn postings but attracted 35% of applications in September 2025.
Their application share was approximately 4.4 times their posting share. That ratio measures disproportionate demand, not applications per completed hire.
The research does not establish a hybrid-only applications-per-hire benchmark.
A broader early-2025 LinkedIn measure grouped remote and hybrid positions together: approximately 20% of postings received up to 60% of applications. It cannot isolate hybrid competition.
The September LinkedIn figures imply that non-remote jobs accounted for 92% of paid postings and 65% of applications.
“Non-remote” can include hybrid arrangements. It should not be treated as a strictly on-site category.
Ashby provides a more direct comparison within its startup sample: remote positions received 1.42 times the inbound applications of in-office positions.
Measure | Remote result | Comparison |
Ashby startup application volume | 1.42 times in-office volume | Direct within-dataset comparison |
LinkedIn application share, September 2025 | 35% | 65% for non-remote jobs |
LinkedIn posting share, September 2025 | 8% | 92% for non-remote jobs |
Neither dataset establishes a universal remote applications-per-hire count across all employers.

Gem’s department conversion rates cover June 2024–May 2025. Its broader report includes 165 million applications, 15 million candidates, and 1.2 million hires.
Gem counts inbound applicants and interested sourced candidates entering the ATS. The following estimates invert rounded conversion rates, so they are approximate ATS entries per hire.
Function | Application-to-hire rate | Approximate ATS entries per hire |
Engineering | 0.2% | 500 |
IT/InfoSec | 0.3% | 333 |
Sales | 0.7% | 143 |
Marketing | 0.2% | 500 |
People/HR | 0.2% | 500 |
Finance | 0.3% | 333 |
Operations | 0.6% | 167 |
Customer service/support | 0.6% | 167 |
Engineering’s conversion rate implies a larger ATS pool per hire than IT/InfoSec.
Ashby separately recorded 17.9 interviews per engineering hire during Q1 2025–Q1 2026. Interview counts measure recruiting activity rather than applicant volume.
Sales had the highest application-to-hire conversion among the functions in the table.
Gem recorded 21.3 interviews per sales hire and 26.4 per marketing hire in 2025, compared with 14.0 and 18.6 in 2021.
People/HR had a 27-day median hiring cycle in Gem’s dataset.
Ashby’s separate function-level analysis recorded 14.3 interviews per HR hire. The two measures describe different aspects of the hiring process.
Gem reported 34 median days to hire for finance.
The benchmark does not separately identify accounting positions, so its department-level estimate should not be presented as an accounting-only result.
Gem reported median hiring times of 22 days for operations and 21 days for customer service/support.
Customer support was Ashby’s least interview-intensive function, averaging 9.5 interviews and 8.9 interviewer hours per hire.

Gem’s aggregate conversion rate implies approximately 200 ATS entries per hire. This includes interested sourced candidates and should not be interpreted as 200 independently submitted inbound applications.
The aggregate rate also differs from department-level rates because the overall hiring mix includes functions with different conversion levels.
Gem’s first-stage passthrough declined from 13% in June 2021–May 2022 to 8% in June 2024–May 2025.
In its 2025 channel comparison, 6% of inbound candidates cleared the first screen, compared with 86% of sourced candidates.
Gem’s pre-onsite-to-onsite conversion declined from 30% to 19% across the same reporting windows.
“Pre-onsite” can include recruiter screens, hiring-manager screens, and assessments. It is broader than a single initial telephone interview.
Gem’s onsite-to-offer rate fell from 47% to 39%.
Ashby’s broader interviewed-candidate measure was 10.4% for business roles and 7.3% for technical roles in Q1 2026. Different stage definitions explain why these rates are not directly comparable.
Gem’s latest offer-to-hire rate implies approximately 1.22 offers per accepted hire. Department-level acceptance ranged from below the aggregate to above it, at 82% overall, with reported rates spanning the 82% benchmark’s broader range of 82%?

Lighthouse Hiring’s proprietary sample of 50,885 applications found that 4.66% matched at least 80% of listed criteria and 18.3% matched at least 60%.
A further 66.4% matched less than 40%. These thresholds do not establish a representative percentage meeting employers’ minimum requirements.
A current, representative qualified-applicants-per-vacancy average is unavailable.
Workable’s historical U.S./Canada benchmark instead measured qualified candidates per hire:
Function | Historical qualified candidates per hire |
Administrative/HR | 27 |
Engineering | 24 |
Marketing/creative | 24 |
Finance/accounting | 22 |
Sales | 20 |
Customer service | 19 |
These are dated hiring benchmarks, not current vacancy averages.
The research does not support a universal unqualified-applications-per-hire count. Falling below an 80% criteria-match threshold does not necessarily mean a candidate cannot perform the job.
HBS and Accenture found that 88% of surveyed employers believed qualified high-skill candidates were excluded for failing to match exact criteria. The figure was 94% for middle-skill candidates.
Gem recorded 2.5% hire conversion for sourced candidates, compared with 0.3% for inbound candidates.
CareerPlug found careers-page applicants were four times more likely to be hired than job-board applicants. These results measure channel conversion; they do not independently establish candidate ability.

Greenhouse’s research reports that 74% of U.S. candidates and 78% of European candidates used AI during their job search.
AI use includes activities beyond submitting applications. These percentages therefore cannot establish the share of applications generated or submitted automatically.
The research does not provide representative conversion rates specifically isolating LinkedIn Easy Apply or Indeed Apply.
Lower submission friction can affect application volume, but observed increases also coincide with changing job supply, remote competition, and wider AI adoption. A fixed causal multiplier is unsupported.
Greenhouse’s CEO described tools costing approximately $20 that could mass-submit applications across the platform.
The reported platform snapshot included about 175,000 live jobs averaging 254 applications each. It demonstrates mass-application capability without establishing the proportion of submissions produced by automation.
HBS and Accenture found that recruiting systems initially filtered or ranked candidates at 94% of surveyed employers hiring middle-skill workers and 92% hiring high-skill workers.
These are employer adoption rates. They are not percentages of resumes rejected.
The research provides no defensible dataset for the frequently repeated claim that ATS platforms automatically reject 75% of resumes.

Ashby recorded 76 median days to first fill for technical roles, compared with 56 days for business roles.
Technical hiring required 23.3 interviewer hours per hire, versus 12.2 hours for business hiring. Large applicant pools can therefore coexist with longer hiring cycles.
SmartRecruiters’ comparatively low healthcare applicant volume indicates a smaller recruiting pool in that dataset.
Its industry benchmark does not isolate individual healthcare occupations or license requirements. It cannot establish a nurse-only or physician-only applications-per-hire average.
No reliable current applications-per-hire benchmark covers skilled trades as a whole.
The research’s BLS-based occupational projections include the following annual openings:
Occupation | Projected annual openings, 2025–2035 |
Electricians | 72,700 |
Automotive service technicians | 66,200 |
Carpenters | 62,800 |
Industrial machinery mechanics/millwrights | 51,900 |
Plumbers/pipefitters | 42,000 |
HVAC mechanics | 40,600 |
Welders | 40,300 |
These are labor-demand projections, not applicant counts.
Gem’s data science conversion rate was 0.1%, implying approximately 1,000 ATS entries per hire, with 42 median days to hire.
Ashby separately recorded 19.5 interviews per data-role hire, the highest function-level interview count cited in the research.
Sources: Ashby, SR, Boostpoint, Gem

ISE’s U.K. graduate vacancy benchmark increased 14% year over year in 2025, reaching the highest level in its three-decade series.
Two-thirds of employers reported rising applications per graduate hire, and 23% reported increases above 50%.
Sector | Applications per graduate hire |
Retail/FMCG/tourism | 290 |
Health/pharmaceuticals | 220 |
Built environment | 73 |
Legal | 69 |
LinkedIn found that remote jobs represented 9% of newly listed U.S. positions in late 2024, compared with 16% of still-active jobs attracting applications.
The difference distinguishes new posting supply from the stock of openings candidates could still apply to. Neither percentage measures completed hires.
An analysis of 1,000 U.S. marketing listings reported the following posting-level applicant counts:
Marketing specialty | Applicants per posting |
SEO/content | 89 |
Conversion rate optimization | 98 |
Growth/performance | 104 |
Social media | 110 |
General digital marketing | 125 |
These values are not interchangeable with Gem’s marketing ATS-entry estimate.
A current administrative-only applications-per-hire benchmark is unavailable.
Workable’s historical comparison groups administration with HR. That grouping prevents a precise estimate for administrative assistants, office coordinators, or other individual administrative occupations.

The research does not provide a credible numerical 2027 applications-per-hire forecast.
Employ’s 2025 recruiter survey found that 66% reported year-over-year growth in applicants per requisition. This supports continued workload pressure, but it is an observed survey result rather than a projected growth rate.
Robert Half reported that 3% of U.S. professional postings were fully remote and 10% were hybrid in Q2 2026.
LinkedIn’s evidence indicates that remote posting supply contracted faster than applicant demand. Continued disproportionate competition is a reasonable directional expectation if that imbalance persists, but no verified applications-per-remote-hire forecast is available.
Widespread candidate AI use and the availability of mass-submission tools support the possibility of continued application pressure.
The research does not isolate how much future growth AI will cause. A numerical projection would require assumptions about job supply, candidate behavior, application friction, and employer filtering that the available studies do not quantify.
Applications-per-hire benchmarks are most useful when the reporting period, employer population, candidate definition, and denominator are stated together. Comparing like-for-like measures preserves their value for citations; treating posting counts, ATS entries, and completed-hire ratios as equivalent obscures the results.
You are currently viewing a placeholder content from Calendly. To access the actual content, click the button below. Please note that doing so will share data with third-party providers.
More InformationYou are currently viewing a placeholder content from Calendly. To access the actual content, click the button below. Please note that doing so will share data with third-party providers.
More InformationYou need to load content from reCAPTCHA to submit the form. Please note that doing so will share data with third-party providers.
More InformationYou are currently viewing a placeholder content from Turnstile. To access the actual content, click the button below. Please note that doing so will share data with third-party providers.
More InformationYou are currently viewing a placeholder content from Vimeo. To access the actual content, click the button below. Please note that doing so will share data with third-party providers.
More InformationYou need to load content from reCAPTCHA to submit the form. Please note that doing so will share data with third-party providers.
More InformationYou are currently viewing a placeholder content from Elfsight. To access the actual content, click the button below. Please note that doing so will share data with third-party providers.
More InformationYou are currently viewing a placeholder content from reCAPTCHA. To access the actual content, click the button below. Please note that doing so will share data with third-party providers.
More Information